Hoelz Lab: Publications
Figure 1. Analysis of the Acl4•RpL4 structure
(a) Domain representation of Acl4 and RpL4 from Chaetomium thermophilum. Acl4: unstructured N- and C-terminal regions (dark gray); central TPR domain (blue). RpL4: core (yellow); loop (red); C-terminal extension (dark gray). Black bars represent crystallized fragments. (b) Crystal structure of the Chaetomium thermophilum Acl4•RpL4 complex, shown in cartoon representation. A 90° rotation is shown on the right. Coloring is according to panel A. (c) Superposition of Acl4 apo (gray) (PDB ID 4YNV) with Acl4•RpL4 (blue). (d) Cartoon representation of the S. cerevisiae large ribosomal subunit (PDB ID 4V88) showing RNA (gray), proteins (teal), and RpL4 (yellow). Superposition of Acl4-bound RpL4 with ribosome-bound RpL4 (gray).

Figure 2. Acl4•RpL4 interaction analysis
(a) Schematic representation of the Acl4-RpL4 interface, colored as in Fig. 1. Colored dots indicate the interaction type between depicted residues. (b) Acl4•RpL4 interaction hotspots. Boxes show three interactions between RpL4 (red) and Acl4 (blue) in cartoon representation. (c) Schematic representation of the Acl4 TPR domain fold architecture. The positioning of RpL4 interaction residues is indicated. (d) Mutational analysis of the Acl4-RpL4 interaction. Acl4 (gray) and RpL4LOOP (red) are shown in surface and cartoon representation, respectively. Mutated Acl4 residues are plotted on the surface and colored according to effect on RpL4 binding: green, no effect; orange, medium effect; and red, strong effect. (e) Interaction analysis of Acl4 and RpL4ΔEXT. Pull-down interaction analysis between S. cerevisiae GST-Acl4 variants (bait) and RpL4ΔEXT. Loaded (top) and pulled-down (bottom) fractions are indicated and Acl4 mutations are depicted above each lane. (f) Growth analysis of Acl4 variants. Residue numbering is according to C. thermophilum Acl4. (g) Western blot analysis of the expression levels of Acl4 variants in S. cerevisiae. HA-tagged Acl4 variants and the hexokinase loading control were detected with anti-HA and anti-hexokinase antibodies, respectively.
Figure 3. Biochemical Acl4•RpL4•Kap104 interaction map
(a, b) Size exclusion chromatography (SEC) analysis of Acl4, Acl4•RpL4, and SUMO-RpL4EXT. SEC profiles of proteins or protein complexes are shown individually (blue and red) and after preincubation (green). (c) GST pull-down of pre-purified GST-Acl4 and Acl4•RpL4 C-terminal truncation variants. Loaded (top) and pulled-down (bottom) fractions are shown. Cartoon representation of RpL4 with RpL4LOOP, RpL4CORE, and RpL4EXT colored as in Fig. 1a. The basic PY-NLS is colored in green and the analyzed fragment boundaries are indicated. As reference, the primary sequence of the basic PY-NLS and the consensus residues are shown. (d) GST pull-down with pre-purified GST-Acl4 and Acl4•RpL4 variants. (e) GST pull-down with pre-purified GST-Kap104 and Acl4ΔN•RpL4 variants. Labeling indicates RpL4 variants (WT, wild type; KKR, K316A/K317A/R321A; PY, P331A/Y332A; R, R328A). (f) GST pull-down with pre-assembled Acl4•RpL4•GST-Acl4 and increasing amounts of Kap104. (g) GST pull-down with pre-assembled Acl4•RpL4•GST-Kap104 and increasing amounts of RanGTP. (h) Schematic representation of the Acl4•RpL4•Kap104 interaction map
Figure 4: Shielding of Tom1 ubiquitination sites
(a) Surface representation of ribosome-bound RpL4 (PDB ID 4V88)17. Acl4 and Kap104 binding sites are indicated with black bars. (b) Acl4-bound RpL4 (colored as in Fig. 1a) and Acl4 (blue) are shown in surface and cartoon representation, respectively. The inset marks the Tom1 ubiquitination site that is illustrated in detail on the right. Acl4 (blue) and RpL4 (red) and critical residues highlighted in stick representation with a section of the final 2|Fo|-|Fc| electron density map contoured at 1.0 σ. (c) Crystal structure of the hsKap104•RpL4EXT complex. The inset marks the location of the Kap104 PY-NLS binding site that is illustrated in detail on the right. The residues of the PY-NLS consensus sequence, Arg328, Pro331 and Tyr332 are highlighted in stick representation with a section of the final 2|Fo|-|Fc| electron density map contoured at 1.0 σ. Magenta circles indicate the approximate location of RpL4 residues K310 and K340 that are ubiquitinated by Tom1 in the absence of Kap104.
Figure 5: Model for nuclear import and balancing of RpL4
(a) Acl4- and Kap104-mediated nuclear import of RpL4. The cycle involves seven steps. (1) Following translation, nascent RpL4 is protected by two copies of Acl4 at its unstructured loop and at the unstructured C-terminal extension. (2) A stoichiometric hetero-trimeric nuclear import complex is formed by binding of Acl4RpL4 to the transport factor Kap104. Kap104 binding occurs in a bi-partite fashion and involves the basic unstructured N-terminal region of Acl4 and RpL4EXT, displacing the RpL4EXT-bound Acl4 copy. (3) Kap104 dependent transport of Acl4RpL4 through the NPC. (4) After successful transport, the Acl4RpL4Kap104 import complex is disassembled by nuclear RanGTP, releasing Acl4RpL4 into the nucleoplasm. (5) RpL4EXT contacts RpL18 and expansion segment 7 on the surface of the pre-60S subunit10. (6) Constructive interactions result in disassembly of the Acl4RpL4 complex and incorporation of RpL4 into the large pre-ribosomal subunit. (7) Potential nuclear export of Acl4 allows its entering into the next RpL4 transport cycle. (b) Balancing of excess unassembled ribosomal proteins. In the absence of Acl4 and Kap104, unassembled RpL4 is ubiquitinated by Tom1 and degraded by the proteasome-dependent degradation machinery.
PDB coordinates (link to PDB site) -
PDBCoordinates (*.pdb)
Structure Factors (.txt) -
Figures from the paper:
Coordinates:
Abstract:
Eukaryotic ribosome biogenesis requires the nuclear import of ∼80 nascent ribosomal proteins and the elimination of excess amounts by the cellular degradation machinery. Assembly chaperones recognize nascent unassembled ribosomal proteins and transport them together with karyopherins to their nuclear destination. We report the crystal structure of ribosomal protein L4 (RpL4) bound to its dedicated assembly chaperone of L4 (Acl4), revealing extensive interactions sequestering 70 exposed residues of the extended RpL4 loop. The observed molecular recognition fundamentally differs from canonical promiscuous chaperone–substrate interactions. We demonstrate that the eukaryote-specific RpL4 extension harbours overlapping binding sites for Acl4 and the nuclear transport factor Kap104, facilitating its continuous protection from the cellular degradation machinery. Thus, Acl4 serves a dual function to facilitate nuclear import and simultaneously protect unassembled RpL4 from the cellular degradation machinery.
California Institute of Technology
Division of Chemistry & Chemical Engineering
1200 E. California Blvd.
Pasadena, CA 91125-7200
© Copyright Hoelz Laboratory

Molecular basis for protection of ribosomal protein L4 from cellular degradation
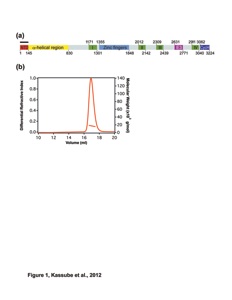
Figure S1. Representations of the Acl4RpL4 and Kap104RpL4EXT crystal structures.
(a) Stereo view of a stick representation of Acl4RpL4 with a section of the final 2|Fo|-|Fc| electron density map contoured at 1.0 σ.
(b) Stereo view of a stick representation of Kap104RpL4EXT with a section of the final 2|Fo|-|Fc| electron density map contoured at 1.0 σ.
(c) The architecture of the Acl4RpL4 complex is represented by the schematic arrangement of its secondary structure elements. The coloring is according to the color scheme in Fig. 1a.
Figure S2. Multispecies sequence alignment of Acl4.
Protein sequences of Acl4 from 16 species were aligned and colored according to a BLOSUM62 matrix. The sequence conservation is represented in shading from white (< 40 % similarity), yellow (40 % similarity) to dark red (100 % identity). Numbering of the alignment below is relative to the C. thermophilum Acl4 protein sequence. The secondary structure of Acl4 as observed in the Acl4•RpL4 structure is shown in blue rectangles, representing α-helices (α A to α O) and gray lines indicate coil regions. Purple dots indicate Acl4 surface residues that were mutated in this study.
Figure S3. Multispecies sequence alignment of RpL4.
Protein sequences of RpL4 from 12 species were aligned and colored according to a BLOSUM62 matrix. The sequence conservation is represented in shading from white (< 50 % similarity), yellow (50 % similarity) to dark red (100 % identity). Numbering of the alignment is relative to C. thermophilum RpL4. The secondary structure of RpL4 as observed in the Acl4•RpL4 crystal structure is illustrated with arrows and rectangles, representing beta-strands (β 1 to β 5) and α-helices (α 1 to α 9), respectively, and colored according to Fig. 1a. Gray dots indicate residues that were part of the crystallization construct but were not observed in the final electron density map and thus are presumed to be disordered. Purple dots indicate RpL4EXT residues that were mutated in this study. Residues corresponding to RpL4CORE, RpL4LOOP, and RpL4EXT are highlighted by a yellow, red and gray bar, respectively.
Figure S4. Conservation and electrostatic surface analysis of the Acl4•RpL4 crystal structure.
(a) Surface representations of Acl4 colored according to the multi-species sequence alignment shown in Supplementary Fig. 2. RpL4 is shown in cartoon representation and colored in teal. The Acl4•RpL4 complex is shown from the front, side and top. (b) Surface representations of Acl4 colored according to its electrostatic surface potential from -5 kBT/e (red) to +5 kBT/e (blue). RpL4 is shown in cartoon representation and colored in teal. (c) Surface representation of RpL4 colored according to the multi-species sequence alignment shown in Supplementary Fig. 3. Acl4 is shown in cartoon representation and colored in green. (d) Surface representations of RpL4 colored according to its electrostatic surface potential from -5 kBT/e (red) to +5 kBT/e (blue).

Huber, F.M. and Hoelz, A.*
(2017). Nature Communications, 14354
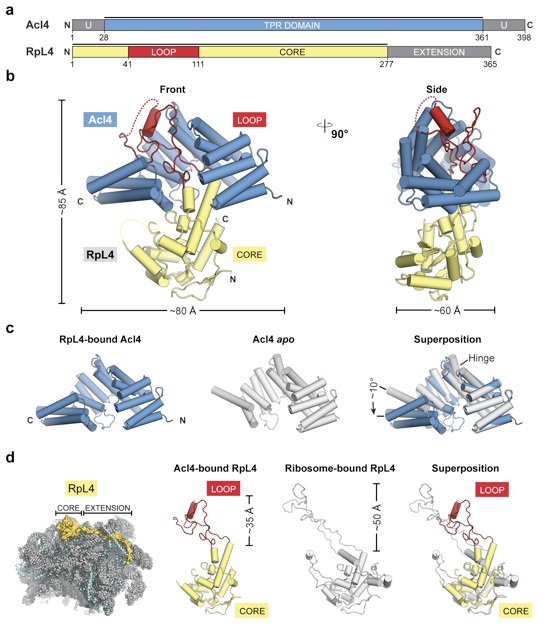
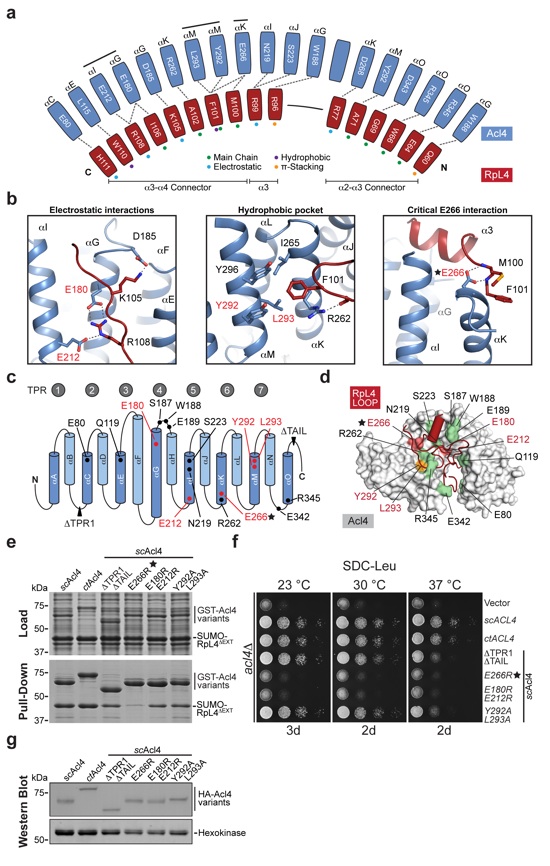
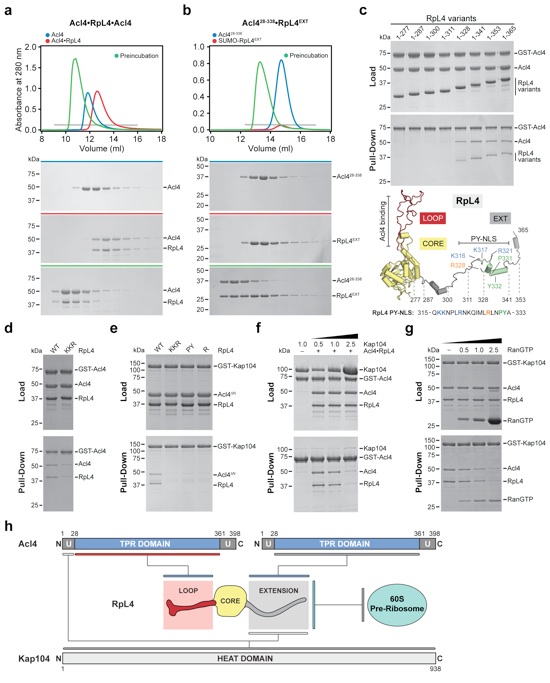
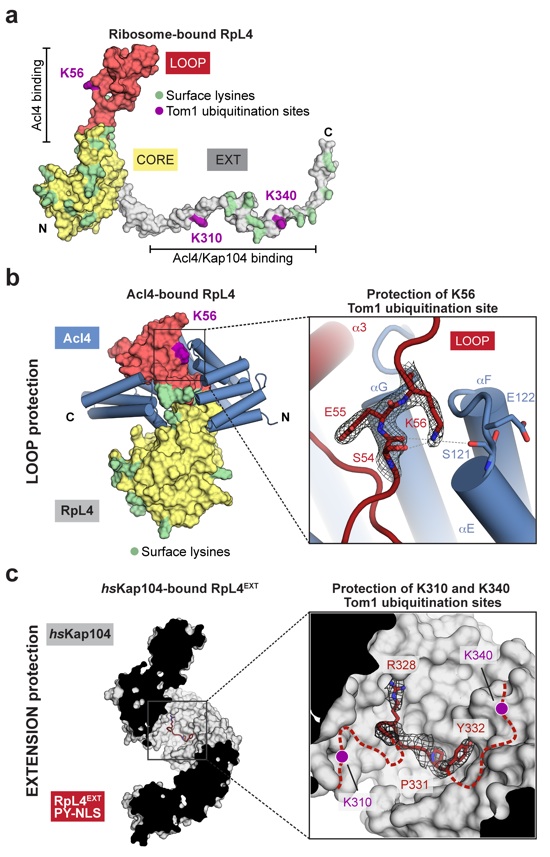
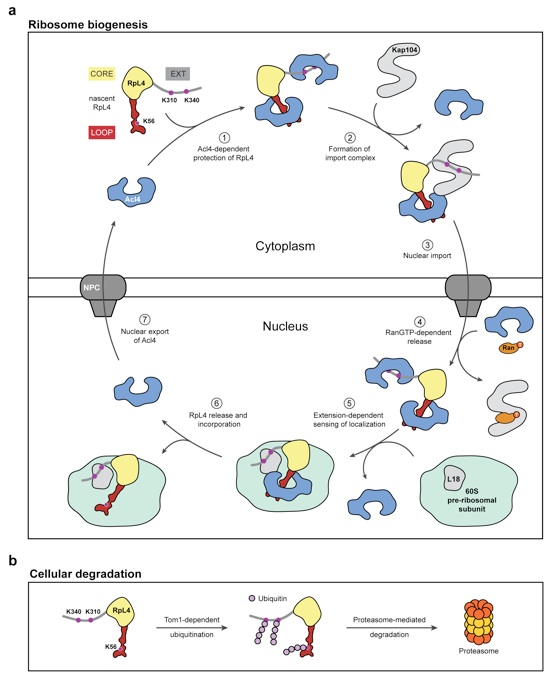
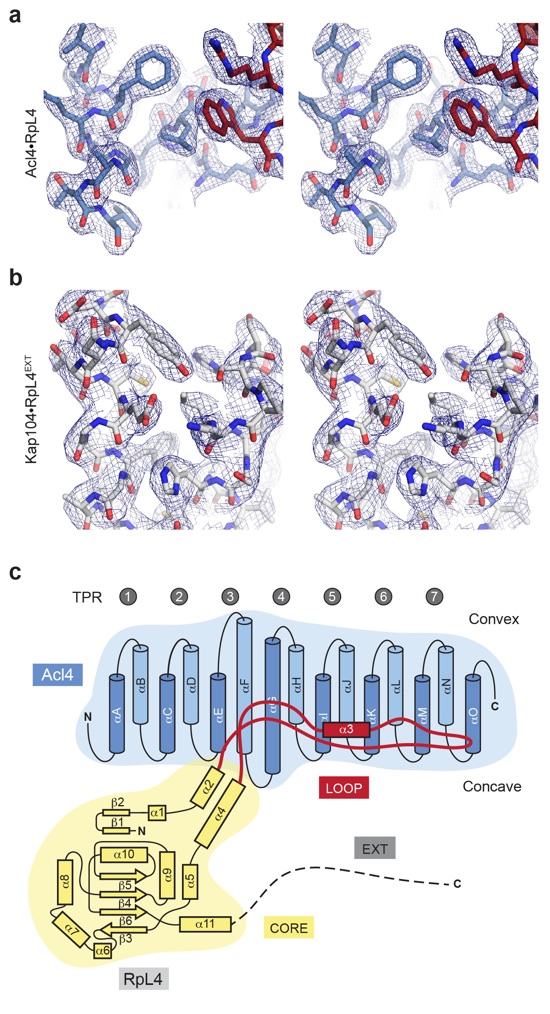
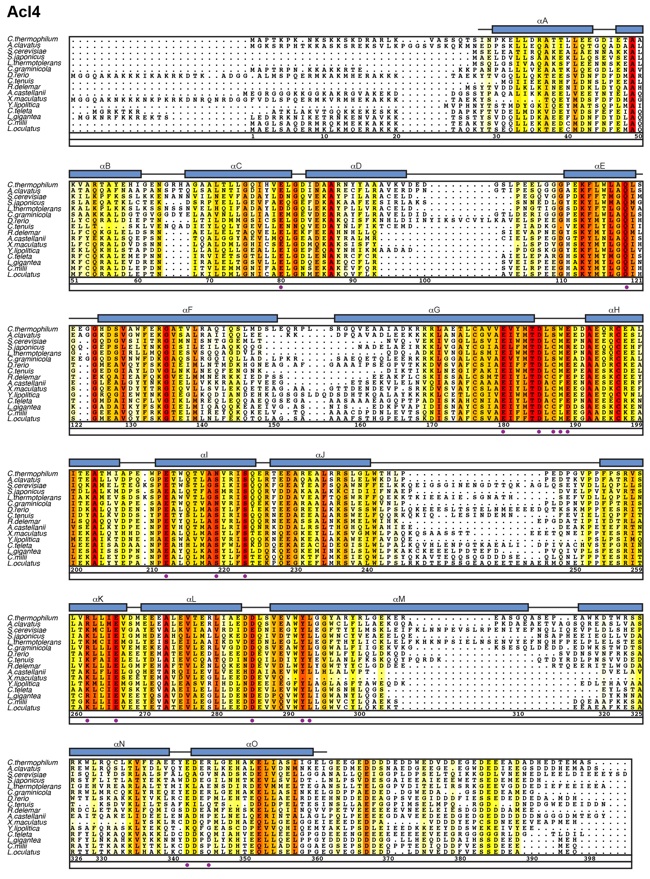
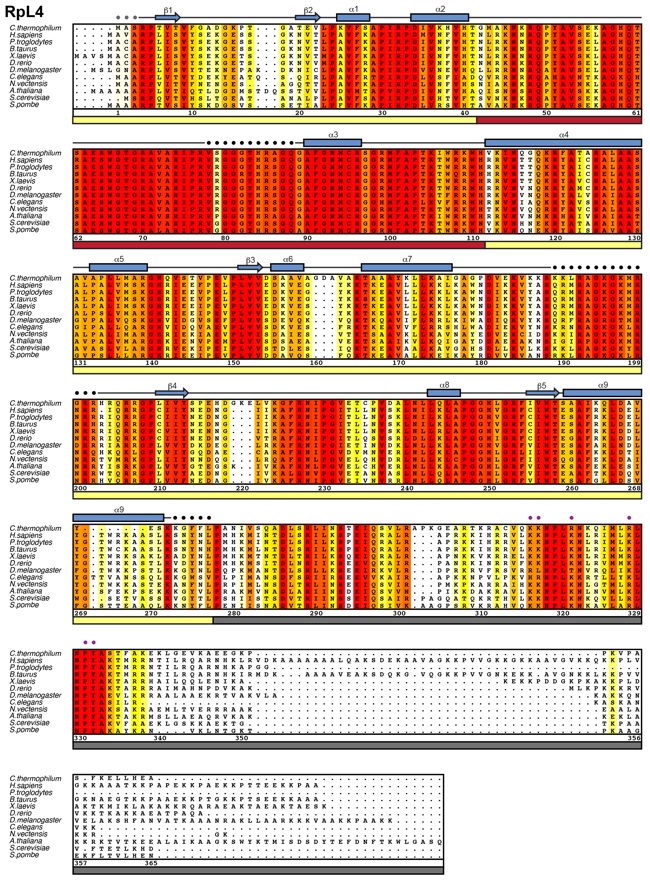
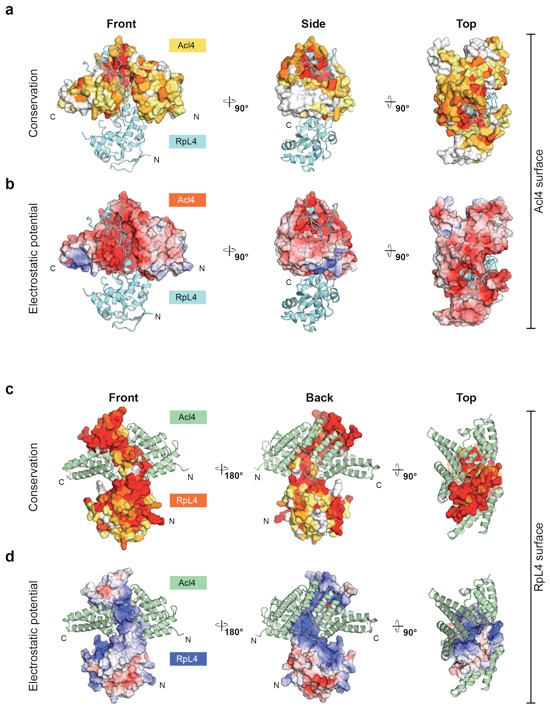
Figure S5. Interaction analysis of C. thermophilum Acl4 surface mutations.
GST pull-down interaction analysis of His6-SUMO-RpL4ΔEXT and GST-Acl4 variants. Samples were resolved on SDS-PAGE gels and visualized by Coomassie Brilliant Blue staining. SDS-PAGE gels on top and bottom show the loaded soluble fraction that was incubated with glutathione beads and eluted pulled-down samples, respectively.
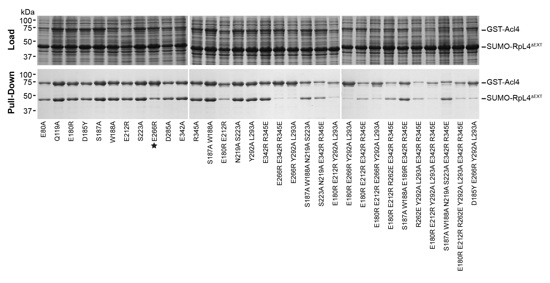
Figure S6. Biochemical analysis of the scAcl4 E266R mutant
Size exclusion chromatography (SEC) analysis of the scAcl4 E266R mutant. The absorbance at 280 nm is plotted against the elution volume of a Superdex 200 10/300 GL size exclusion column. Fractions indicated by a gray bar were resolved by SDS-PAGE gel and visualized by Coomassie Brilliant Blue staining.
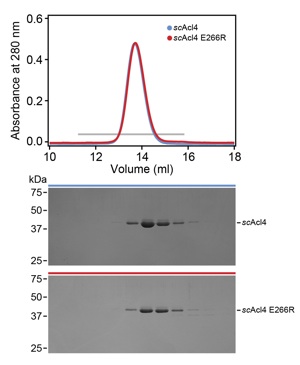
Figure S7. In vivo localization analysis of Acl4 and RpL4.
(a) Subcellular localization analysis of mCherry-tagged Acl4 variants (red) and eGFP-tagged RpL4 (green) in a S. cerevisiae acl4Δ strain. Differential interference contrast (DIC) images are shown in gray scale. The left panel represents yeast grown to mid-log phase at 30 °C, while the right panel shows cells that were grown to mid-log phase at 30 °C and then shifted to 37 °C for 6 hours. Scale bars are 5 μm. (b) Original uncropped Western blots of Fig. 2g. Black boxes indicate the cropped sections of the same membrane probed and visualized with different antibodies.
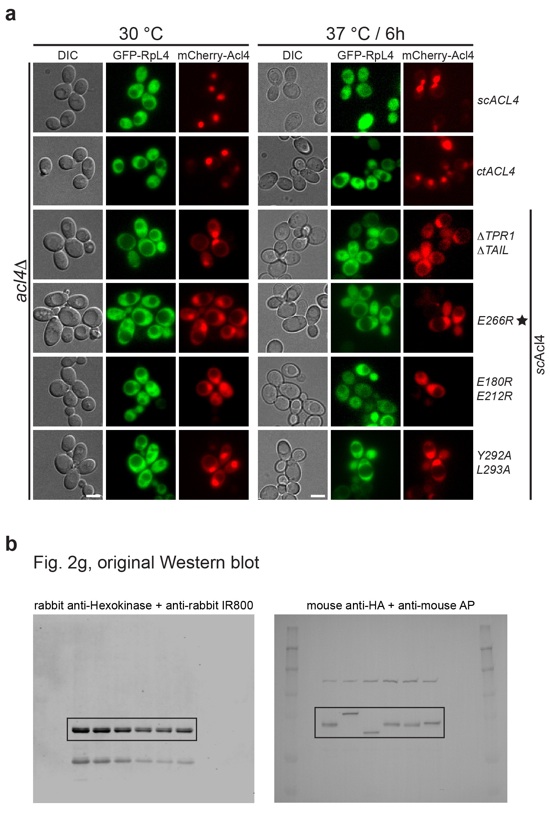
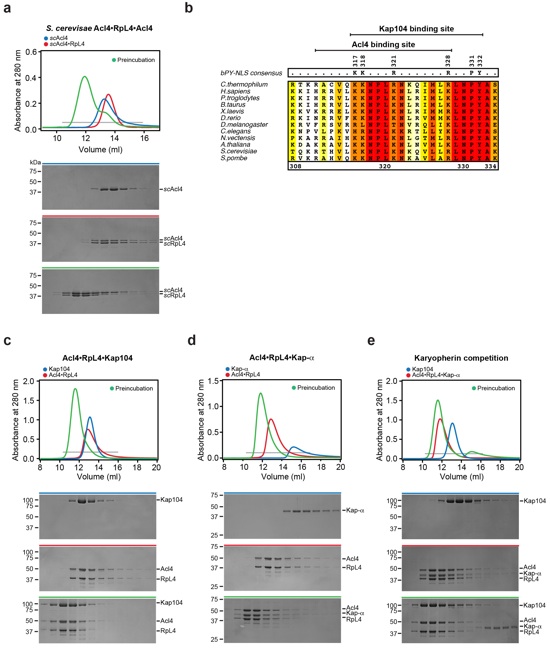
Figure S8. Biochemical analysis of RpL4EXT interaction partners.
(a) Size exclusion chromatography (SEC) analysis of the S. cerevisiae Acl4RpL4Acl4 complex. The absorbance at 280 nm is plotted against the elution volume of a Superdex 200 10/300 GL size exclusion column. (b) Protein sequences of RpL4 from 12 species were aligned and colored as in Supplementary Fig. 3. The consensus sequence of the basic PY-NLS is shown above the alignment. Numbering below the alignment is relative to C. thermophilum RpL4. Kap104 and Acl4 binding sites are indicated with black bars. (c) SEC analysis of the Acl4RpL4Kap104 complex. (d) SEC analysis of the Acl4RpL4Kap-α complex. (e) SEC analysis of a preformed Acl4RpL4Kap-α complex incubated with additional Kap104. Fractions indicated by a gray bar were resolved by SDS-PAGE gel and visualized by Coomassie Brilliant Blue staining.
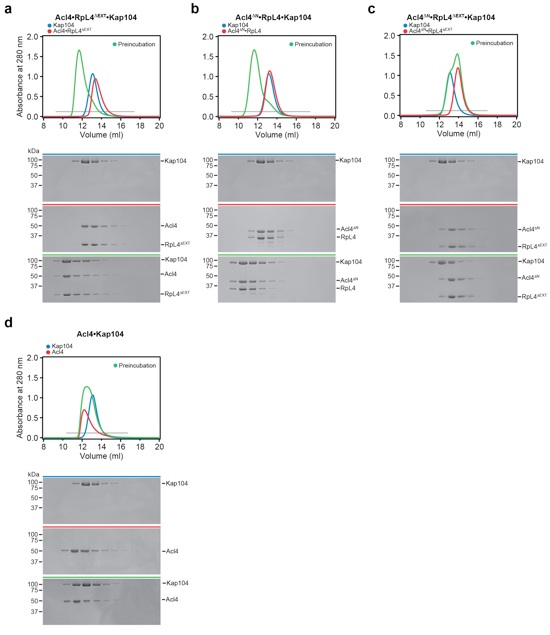
Figure S9. Kap104 interaction with Acl4RpL4.
(a) Size exclusion chromatography (SEC) analysis of the Acl4RpL4ΔEXTKap104 complex. The absorbance at 280 nm is plotted against the elution volume of a Superdex 200 10/300 GL size exclusion column. (b) SEC analysis of the Acl4ΔNRpL4Kap104 complex. (c) SEC analysis of the Acl4ΔNRpL4ΔEXTKap104 complex. (d) SEC analysis of Acl4Kap104. The elution profile and SDS-PAGE gel of Kap104 is included in panels a-d as reference point for Kap104 elution. Fractions indicated by a gray bar were resolved by SDS-PAGE gel and visualized by Coomassie Brilliant Blue staining.