Hoelz Lab: Publications

Coordinates:
Abstract:
California Institute of Technology
Division of Chemistry & Chemical Engineering
1200 E. California Blvd.
Pasadena, CA 91125-7200
© Copyright Hoelz Laboratory

Architecture of the cytoplasmic face of the nuclear pore
Christopher J. Bley,# Si Nie,# George W. Mobbs,# Stefan Petrovic,# Anna T. Gres,# Xiaoyu Liu,# Somnath Mukherjee, Sho Harvey, Ferdinand M. Huber, Daniel H. Lin, Bonnie Brown, Aaron W. Tang, Emily J. Rundlet, Ana R. Correia, Shane Chen, Saroj G. Regmi, Taylor A. Stevens, Claudia A. Jette, Mary Dasso, Alina Patke, Alexander F. Palazzo, Anthony A. Kossiakoff, André Hoelz*
(2022). Science, 376, eabm9129
Figures from the paper:


The nuclear pore complex (NPC) is the sole bidirectional gateway for nucleocytoplasmic transport. Despite recent progress in elucidating the NPC symmetric core architecture, the asymmetrically decorated cytoplasmic face, essential for mRNA export and a hotspot for nucleoporin-associated diseases, has remained elusive. Here, we report a composite structure of the human cytoplasmic face obtained by combining biochemical reconstitution, crystal structure determination, docking into cryo‑electron tomographic reconstructions, and physiological validation. Whereas species‑specific motifs anchor an evolutionarily conserved ~540kDa hetero‑hexameric cytoplasmic filament nucleoporin complex above the central transport channel, attachment of the NUP358 pentameric bundles depends on the double-ring arrangement of the coat nucleoporin complex. Our composite structure and its predictive power provide a rich foundation for elucidating the molecular basis of mRNA export and nucleoporin diseases.
Fig. 1. Reconstitution of a 16‑protein C.thermophilum complex composed of coat and CF nups. (A) Cross sectional schematic of the fungal NPC architecture. (B) Domain structures of the coat and cytoplasmic filament nups. (C) Schematic representation summarizing our biochemical reconstitution and dissection experiments with purified recombinant C.thermophilum nups, illustrating the cytoplasmic filament nup complex (CFNC) architecture and its attachment to the coat nup complex (CNC). The CNC harbors two assembly sensors, Nup37CTE and Nup145CNTE, each anchoring a CFNC via its central hub, with Nup37CTE exhibiting tighter binding than Nup145CNTE. (D-F) SEC‑MALS interaction analyses, showing the stepwise biochemical reconstitution starting with (D) the CFNC (green) from Nup82•Nup159•Nsp1 (blue), Gle2•Nup145N (cyan), and Dbp5 (red), (E) CFNC•Gle1•Nup42GBM (green) from CFNC (blue) and Gle1•Nup42GBM (red), and culminating with (F) the 16‑protein CNC•CFNC•Gle1•Nup42GBM complex (green) from CNC (red), CFNC (blue), and Gle1•Nup42GBM (cyan). SDS‑PAGE gel strips of peak fractions are shown. Measured molecular masses are indicated, with respective theoretical masses in parentheses. (G, H) Liquid‑liquid phase separation (LLPS) interaction assays, assessing (G) CFNC (red) and Gle1•Nup42GBM (cyan) incorporation into CNC‑LLPS (green), and (H) CFNC incorporation into CNC‑LLPS, lacking either one or both Nup37CTE and Nup145CNTE assembly sensors. N‑terminally fluorescently labeled CNC (Bodipy), CFNC (Alexa Fluor 647), and Gle1•Nup42GBM (Coumarin) were visualized by fluorescence microscopy. Pelleted CNC condensate phase (P) and soluble (S) fractions were analyzed by SDS‑PAGE and visualized by Coomassie brilliant blue staining. Scale bars are 10μm.
Fig. 2. Conserved modular architecture and RNA binding properties of the human CF nups (A) Cross sectional schematic of the human NPC architecture. (B) Domain structures of human cytoplasmic filament nups. Nomenclature of H.sapiens and C.thermophilum nup orthologs is indicated. (C) Biochemical reconstitution of the ~310kDa hetero‑hexameric human CFNC. SEC‑MALS interaction analysis of NUP88•NUP214•NUP62 (blue), DDX19 (ADP) (red), RAE1•NUP98 (cyan), and their preincubation (green). Measured molecular masses are indicated, with theoretical masses in parentheses. SDS‑PAGE gel strips of peak fractions visualized by Coomassie brilliant blue staining are shown. (D) Summary of pairwise SEC‑MALS interaction analyses between human cytoplasmic filament nups. (E) Schematic summary of the human CFNC architecture and the cytoplasmic filament nup interaction network. (F) Human cytoplasmic filament nup domains and complexes were assayed for binding to single‑stranded (ss) and double‑stranded (ds) RNA and DNA probes by electrophoretic mobility shift assay (EMSA). Input proteins resolved by SDS‑PAGE were visualized by Coomassie brilliant blue staining. Qualitative assessment of nucleic acid binding is denoted by color‑coded boxes. (G, H) EMSAs with ssRNA titrated against (G) metazoan‑specific NUP358NTD and NUP358RanBD-IV•Ran(GMPPNP), and (H) the indicated H.sapiens CFNC subcomplexes and their C.thermophilum orthologs.
Fig. 3. Structural analysis and biochemical characterization of NUP358. (A) Domain structure of NUP358. Black lines indicate the boundaries of the crystallized fragments. (B, C) SEC‑MALS analysis of the oligomeric behavior of (B) NUP358NTD and NUP358NTDΔTPR, and (C) NUP358NTD‑OE, performed at the indicated protein concentrations. Measured molecular masses are indicated, with theoretical masses in parentheses. SDS‑PAGE gel strips of peak fractions are shown and visualized by Coomassie brilliant blue staining. (D) Cartoon representation of the NUP358NTD•sAB‑14 co-crystal structure dyad of the P6522 lattice, illustrating the NUP358NTD dimer between symmetry-related molecules. (E) Schematic of the NUP358NTD structure and structural motifs. (F) TPR of molecule 1 complements α‑helical stacking of the N-terminal solenoid of the symmetry‑related molecule 2, generating the open conformation of NUP358NTD. (G) SEC‑MALS analysis of the oligomeric behavior of NUP358OE and the NUP358OE LIQIML mutant performed at the indicated protein concentrations. (H) Cartoon representation of the homo‑tetrameric NUP358OE crystal structure with hydrophobic core residues shown in ball‑and‑stick representation. (I) SEC interaction analysis of NUP358ZnF7 and NUP358ZnF7ΔNTE binding to Ran(GTP). (J) SEC‑MALS interaction analysis of NUP358RanBD-IV binding to Ran(GMPPNP). (K) Co‑crystal structure of NUP358ZnF7•Ran(GDP), shown in cartoon and surface representation (left). The inset indicates the location of the magnified and 90º rotated view of the Ran hydrophobic pocket (middle). Superposition of the six NUP358ZnF•Ran(GDP) and four NUP153ZnF•Ran(GDP) co-crystal structures with the Zn2+‑coordinating cysteines and Ran‑burying NTE hydrophobic residues shown as sticks (right). (L) Co‑crystal structure of NUP358RanBD‑IV•Ran(GMPPNP) with NUP358RanBD‑IV shown in cartoon and Ran(GMPPNP) shown in cartoon (left) or surface (middle) representation. Superposition of Ran(GMPPNP) bound to NUP358RanBD‑I, NUP358RanBD‑II, NUP358RanBD‑III, NUP358RanBD‑IV, and NUP50RanBD (right).
Fig. 4. Docking of NUP358NTD on the cytoplasmic face of the NPC. (A) Overview of the NPC cytoplasmic face with isosurface rendering of unexplained density clusters I (red) and II (cyan) of the ~12Å cryo‑ET map of the intact human NPC. The inset indicates the location of the magnified view showing cartoon representations of five copies of NUP358NTD docked in unassigned density cluster I. (B) Comparison of the binding of two NUP358NTD copies (cartoon) to distal and proximal CNCs (surface). (C-E) Architecture of the pentameric NUP358NTD bundle attachment site on a cytoplasmic outer ring spoke with cartoon- and surface‑represented structures (left) and schematics (right), sequentially illustrating the placement of (C) four copies of NUP358NTD around NUP96 and NUP107 interfaces on the stalks of tandem‑arranged Y‑shaped CNCs, (D) a distal copy of NUP93SOL collocated at the center of the NUP358NTD bundle, interfacing with both proximal and distal CNC stalks, and (E) the NUP358NTD dome copy interfacing with the stalk‑attached NUP358NTD quartet beneath. (F) Overview of the entire cytoplasmic face of the NPC in cartoon representation and as schematic, illustrating the distribution of 40 NUP358NTD copies anchored as pentameric bundles across the eight NPC spokes. (G) Schematic of NUP358 attachment to the cytoplasmic outer ring spoke. The NUP358 pentameric bundle is linked together by interactions between oligomerization elements (OEs). Anchored by NUP358NTD, the rest of NUP358 domains are linked by unstructured linker sequences and are expected to freely project from the cytoplasmic face of the NPC. Distal and proximal positions are labeled according to the legend in (A).
Fig. 5. NUP358 plays a general role in translation of exported mRNA. (A) Subcellular localization by immunofluorescent staining of endogenous nups in synchronized AID::NUP358 HCT116 cells at the indicated time points following auxin‑induced NUP358 depletion. Cytoplasmic puncta arise from NUP88 overexpression inherent to HCT116 cells. (B) Subcellular localization of N‑terminally 3×HA‑tagged NUP358 variants in AID::NUP358 HCT116 cells by immunofluorescence microscopy. mAb414 staining marks nuclear envelope rim location. Domain structure of the transfected NUP358 variants is shown (above). (C) Schematic illustrating the life cycle of messenger ribonucleoprotein particles (mRNPs) from transcription, maturation, export, remodeling at the cytoplasmic face of the NPC, to translation. Steps associated with the NPC are highlighted by a red box. (D) Time‑resolved analysis of RNA nuclear retention in synchronized AID::NUP358 HCT116 cells upon auxin‑induced NUP358 depletion visualizing 5‑EU metabolically pulse‑labeled RNA. Representative images (left) and quantitation (right) of the proportion of cells (n>200/timepoint) with nuclear RNA retention are shown with mean values (squares) and the respective standard error (shaded area) of triplicate experiments. Quantitation from unsynchronized AID::NUP358 DLD1 and NUP160::NG‑AID DLD1 cells are also shown. (E) Time‑resolved western blot analysis of the expression of C‑terminally 3×FLAG‑tagged reporter proteins in synchronized AID::NUP358 HCT116 cells upon auxin‑induced NUP358 depletion. Quantitated reporter expression in auxin‑treated cells was normalized to expression in control cells, at the 10‑hour timepoint. Experiments performed in triplicate, with mean and associated standard error shown. Scale bars are 10μm. Experimental timelines are shown above each experiment.
Fig. 6. Docking analysis reveals that NUP93 anchors the CFNC to the cytoplasmic outer ring. (A) Overview of the NPC cytoplasmic face with isosurface rendering of unexplained density cluster II (cyan) of the ~12Å cryo‑ET map of the intact human NPC. The inset indicates the location of the magnified view in (B). (B, C) Two views of manually placed poly-alanine models of CFNC‑hub segments CCS1 and CCS2, as well as of the tentatively placed NUP88NTD•NUP98APD and NUP214NTD•DDX19 co‑crystal structures shown in cartoon representation. (D) Cartoon representation of a cytoplasmic face spoke. The root‑mean square (r.m.s.) end‑to‑end length estimate for the NUP93R1‑R2 linker defines a ~40Å radius for the expected location of the distal NUP93R1 region. (E) Schematic of a cytoplasmic face spoke illustrating CFNC‑hub anchoring by the distal NUP93R1 positioned by the distal NUP205‑bound NUP93R2. (F) SEC‑MALS interaction analysis showing the binding of SUMO‑NUP93R1 to the hetero‑hexameric CFNC or CFNC‑hub and illustrating the abolished binding of the SUMO‑NUP93R1 LIL mutant to the CFNC-hub. Proteins were visualized by Coomassie brilliant blue staining. (G) An alignment of C.thermophilum Nic96 and H.sapiens NUP93 sequences shows the conservation of residues targeted by the LLLL and LIL mutations that abolish binding to the CNT. Residues are colored according to a multispecies sequence alignment from white (less than 55% similarity), to yellow (55% similarity), to red (100% identity), using the BLOSUM62 weighting algorithm. Domain architectures of NUP214, NUP88, NUP62, and NUP93. The location of the NUP93 LIL mutation is indicated (red dots). (H) Two views of the NUP88NTD•NUP98APD co‑crystal structure in cartoon representation. Inset boxes indicate regions of magnified views (right) of NUP88NTD FGL‑loop interaction with NUP98APD, and of NUP98APD K/R-loop interaction with NUP88NTD. Black triangles indicate alanine substitutions in the NUP88NTD EMNY mutant.
Fig. 7. Comparison of cytoplasmic and nuclear faces of the human NPC. Overall top view (left), single spoke protomer with symmetric core nups in surface, docked asymmetric nups in cartoon, and unexplained density of the ~12Å cryo‑ET map in isosurface representation (middle), and schematic (right) of the (A) cytoplasmic and (B) nuclear face of the intact human NPC. (C) Superpositions of the overall view (left) and two orthogonal views of single spoke protomers (middle and right) of the nuclear and cytoplasmic faces, with hypothetical steric clashes between the cytoplasmic filaments in cartoon representation, and the unassigned asymmetric nuclear density (cyan), indicated. Distal and proximal positions are labeled according to the legend. Inset boxes indicate regions of magnified protomer views (right).
Fig. 8. Architecture of the human NPC cytoplasmic face. Near‑atomic composite structure of the human NPC generated by docking individual nup and nup complex crystal and cryo‑EM structures into a ~12Å cryo‑ET map of the intact human NPC, viewed from (A) the cytoplasmic face, and (B) the central transport channel, as a cross‑section. Newly placed structures include the quantitatively docked NUP358NTD and the manually docked NUP88NTD•NUP98APD, NUP214NTD•DDX19, GLE1CTD•NUP42GBM, ELYSNTD, and a CFNC‑hub model. The nuclear envelope is rendered as a grey isosurface. Nups are shown in cartoon representation and colored according to the legend.
Movie 1. Structure of NUP358NTD. A 360° rotation of the NUP358NTD•sAB-14 co-crystal structure, illustrating the NUP358NTD dimer between symmetry-related molecules, followed by a comparison of the two possible TPR conformations giving rise to the open and closed states, concluding with a 360° rotation of the NUP358NTD open confirmation.
Movie 2. Structure of NUP358OE. A 360° rotation of the of the homo‑tetrameric NUP358OE crystal structure, with hydrophobic core residues shown in ball-and-stick representation followed by an end-on view.
Movie 3. Comparison of NUP358 and Nup153 ZnF Ran(GDP) complexes. Crystal structures of the six NUP358 ZNF•Ran(GDP) and four NUP358 ZNF•Ran(GDP) co-crystal structures are shown individually followed by a superposition. A 360° rotation of the NUP358 and NUP153 ZnF superposition and Ran(GDP) is shown with a zoom-in view showing hydrophobic residues of the ZnF N-terminal extension buried in the Ran hydrophobic pocket. Colors are as in Fig. 3K.
Movie 4. Comparison of NUP358 and Nup50 RanBD Ran(GMPPNP) complexes.
A 360° rotation of the of NUP358RanBD-IV•Ran(GMPPNP) co-crystal structure, colored as in Fig. 3L. A zoom-in view is shown transitioning between the four different NUP358 RanBD structures and the single NUP50RanBD structures, showing hydrophobic residues of the NUP358 RanBD N-terminal extension buried in the Ran hydrophobic pocket. Finally, the interaction of individual RanBD basic patches with the Ran acidic tail is shown, colored as in fig. S55D.
Movie 5. Evolutionary conservation of the NUP88NTD•NUP98APD architecture. A 360° rotation of the of the NUP88NTD•NUP98APD co-crystal structure and the previously determined crystal structures of S. cerevisiae Nup82NTD•Nup116CTD•Nup159TAIL (PDB ID 3PBP) and C. thermophilum Nup82NTD•Nup145NAPD•Nup159TAIL (PDB ID 5CWW) colored as in fig. S77.
Movie 6. Overview of the composite structure of the human NPC cytoplasmic face. The structures are shown docked into the cryo-ET reconstruction of the intact human NPC colored according to Fig. 8. A pentameric bundle of NUP358NTD is docked followed by relative placement of NUP358OE and additional NUP358 domains, followed by the CFNC components. An overview of a single spoke cytoplasmic face protomer is shown followed by a comparison cytoplasmic and nuclear face protomers.
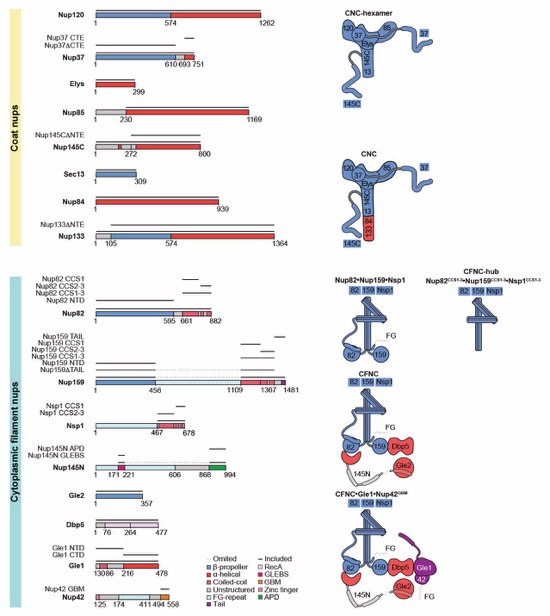
Fig. S1. C. thermophilum nucleoporin fragments. Domain architectures of the C. thermophilum coat and cytoplasmic filament nups. Domains are drawn as horizontal boxes with residue numbers indicated and their observed or predicted folds colored according to the legend. The black lines indicate the fragments used throughout the text. Dashed lines indicate regions excluded from expression constructs. As a reference, schematics of nup complexes are shown on the right.
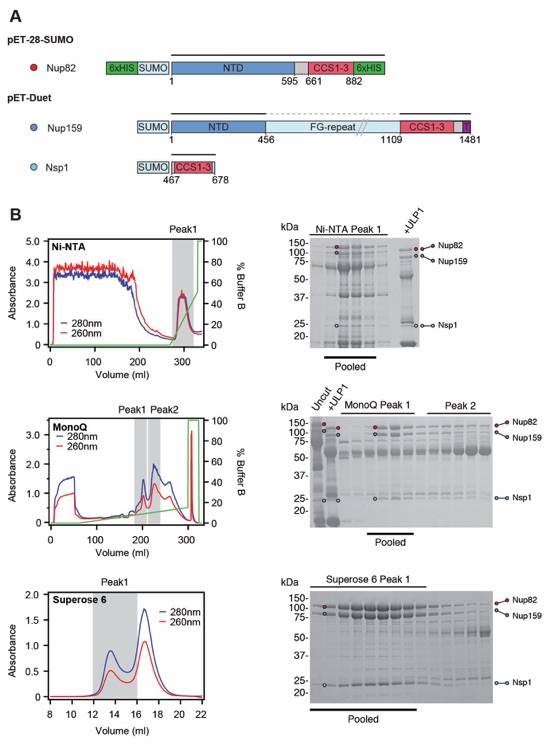
Fig. S2. Purification of the C. thermophilum Nup82•Nup159•Nsp1 hetero‑trimer. (A) Domain boundaries of the purified nups are shown with black lines indicating the construct boundaries of Nup82, Nup159, and Nsp1 in our bacterial expression constructs. The dashed line indicates a central FG-repeat region in Nup159 that was excluded. (B) Nup82•Nup159•Nsp1 hetero‑trimer purification. Sequential chromatography purification steps are shown from top to bottom with the employed columns indicated. The gray boxes indicate fractions that were resolved on SDS-PAGE gels and visualized by Coomassie staining. Pooled fractions are indicated with a black bar below the SDS‑PAGE gels. For details of the buffer conditions see Table S5.
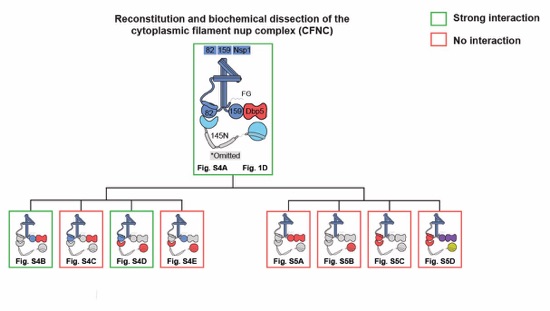
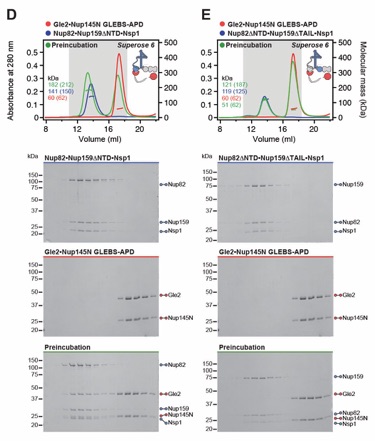
Fig. S3. Biochemical dissection of the CFNC architecture. Summary of the SEC-MALS interaction analyses of the indicated figure panels. Each box in the flow chart represents a SEC‑MALS interaction experiment, involving individually purified CFNC sub-complexes that were tested for their ability to form stochiometric complexes, colored by the experimental outcome; strong interaction (green), no interaction (red). The inset schematics are colored to indicate the CFNC sub‑complexes of each SEC-MALS interaction experiment.
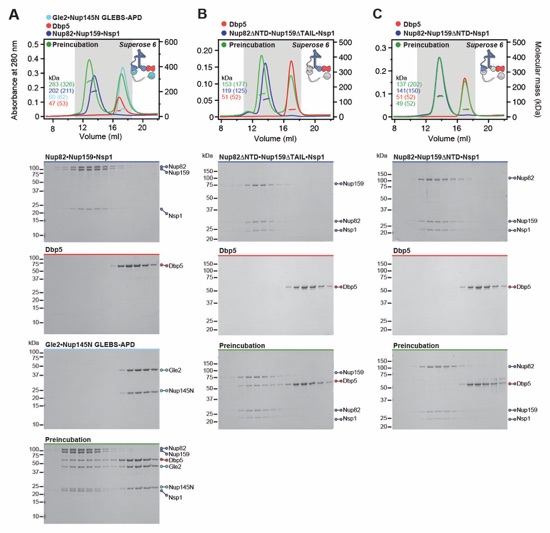
Fig. S4. Reconstitution of the CFNC and elucidation of the Dbp5 and Gle2•Nup145N binding sites. (A) SEC-MALS interaction analysis showing the biochemical reconstitution of the ~290 kDa hetero‑hexameric CFNC from Nup82•Nup159•Nsp1, Gle2•Nup145N, and Dbp5 (corresponding to Fig. 1D). (B, C) SEC-MALS interaction analyses probing the interaction of Dbp5 with (B) Nup82ΔNTD•Nup159ΔTAIL•Nsp1 and (C) Nup82•Nup159ΔNTD•Nsp1 truncated CFNC variants. (D, E) SEC‑MALS interaction analyses probing the interaction of Gle2•Nup145NGLEBS-APD with (D) Nup82•Nup159ΔNTD•Nsp1 and (E) Nup82ΔNTD•Nup159ΔTAIL•Nsp1 truncated CFNC variants. SEC‑MALS profiles of nup complexes are shown individually (red, blue, and cyan) and after preincubation (green). SEC profiles were obtained using a Superose 6 10/300 GL column. Measured molecular masses are indicated, with the respective theoretical masses shown in parentheses. Inset schematics display tested protein samples colored to match the corresponding chromatogram trace. Gray boxes indicate fractions resolved on SDS‑PAGE gels and visualized by Coomassie brilliant blue staining.
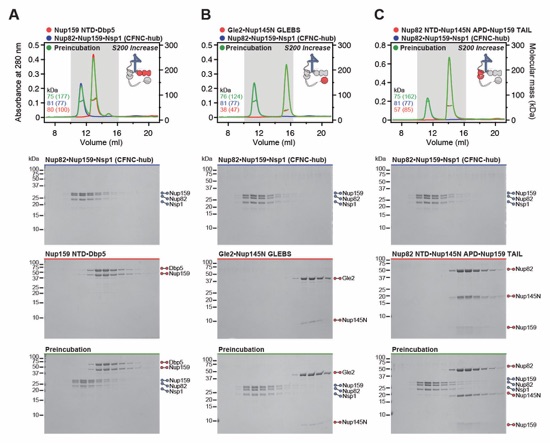
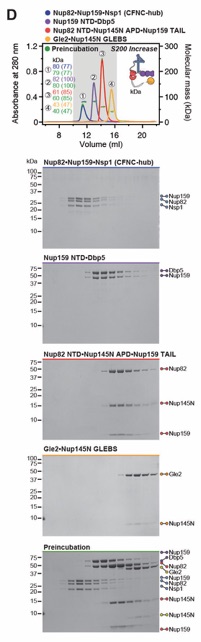
Fig. S5. Biochemical dissection of the CFNC into four distinct non-interacting sub‑complexes. SEC‑MALS interaction analysis of the Nup82•Nup159•Nsp1 CCS1-3 (CFNC‑hub) with (A) Nup159NTD•Dbp5, (B) Gle2•Nup145NGLEBS, (C) Nup82NTD•Nup145NAPD•Nup159TAIL, and (D) a mixture of all four subcomplexes. SEC-MALS profiles of nup complexes are shown individually (red, blue, purple and orange) and after preincubation (green). SEC profiles were obtained using a Superdex 200 Increase 10/300 GL column. Measured molecular masses are indicated, with the respective theoretical masses shown in parentheses. Inset schematics display tested protein samples colored to match the corresponding chromatogram trace. Gray boxes indicate fractions resolved on SDS‑PAGE gels and visualized by Coomassie brilliant blue staining.
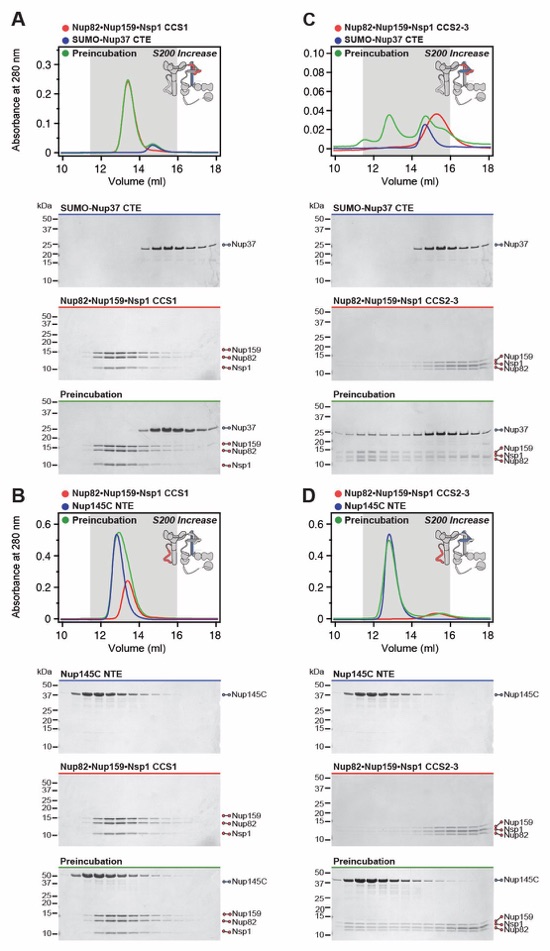
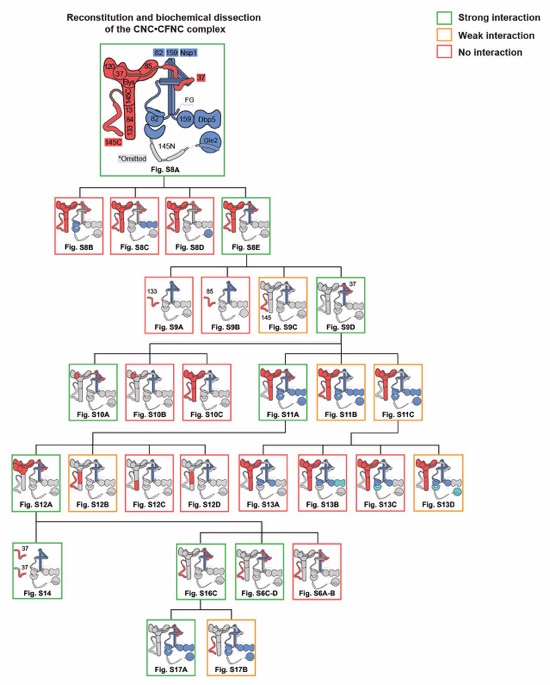
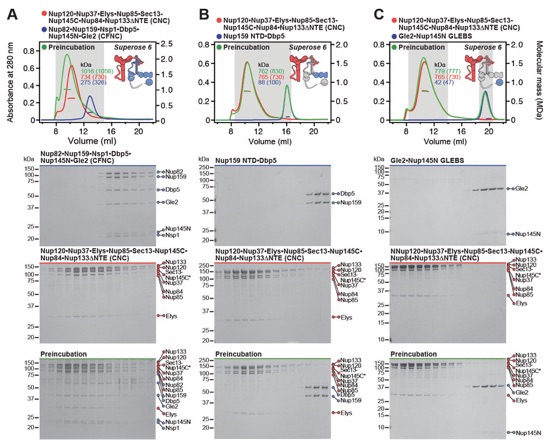
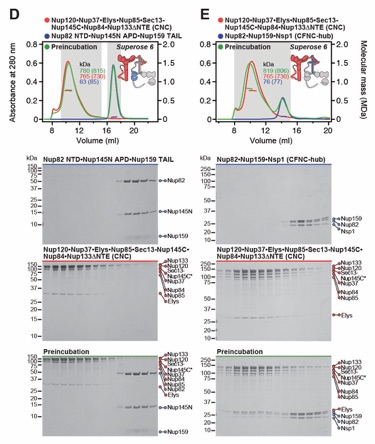
Fig. S6. Biochemical analysis of the Nup37/Nup145C-CFNC-hub interaction. (A, B) SEC interaction analyses of Nup82•Nup159•Nsp1 CCS1 with (A) SUMO‑Nup37CTE and (B) Nup145CNTE, showing that neither form a stable complex. (C, D) SEC interaction analyses of Nup82•Nup159•Nsp1 CCS2-3 with (C) SUMO‑Nup37CTE and (D) Nup145CNTE, demonstrating that both form stable interactions. SEC profiles of nup complexes are shown individually (red, blue) and after preincubation (green). SEC profiles were obtained using a Superdex 200 Increase 10/300 GL column. Inset schematics display tested protein samples colored to match the corresponding chromatogram trace. Gray boxes indicate fractions resolved on SDS‑PAGE gels and visualized by Coomassie brilliant blue staining.
Fig. S7. Reconstitution and dissection strategy for the 14‑protein CNC•CFNC complex. Flow chart detailing reconstitution and biochemical dissection of the 14‑protein C. thermophilum CNC•CFNC complex. Each box in the flow chart represents a SEC‑MALS interaction experiment, involving individually purified CNC and CFNC sub-complexes that were tested for their ability to form stochiometric complexes, colored by the experimental outcome; strong interaction (green), weak interaction (orange), no interaction (red). The inset schematics are colored to indicate the CNC and CFNC sub‑complexes of each SEC-MALS interaction experiment, gray regions stipulate proteins omitted from each analysis.
Fig. S8. Reconstitution and dissection of the 14‑protein CNC-CFNC interaction. (A) SEC‑MALS interaction analysis of the Nup120•Nup37•Elys•Nup85•Sec13‑Nup145C•Nup84• Nup133ΔNTE (CNC) with the intact CFNC, demonstrating the formation of a ~1,016 kDa monodisperse, stochiometric 14-protein CNC•CFNC complex. (B-E) SEC-MALS interaction analysis of the intact CNC with (B) Nup159NTD•Dbp5, (C) Gle2•Nup145NGLEBS, (D) Nup82NTD•Nup145NAPD•Nup159TAIL, and (E) CFNC-hub, showing that of the four distinct CFNC subcomplexes only the CFNC-hub forms a stable interaction with the CNC. SEC‑MALS profiles of nup complexes are shown individually (red, blue) and after preincubation (green). SEC profiles were obtained using a Superose 6 10/300 GL column. Measured molecular masses are indicated, with the respective theoretical masses shown in parentheses. Inset schematics display tested protein samples colored to match the corresponding chromatogram trace. Gray boxes indicate fractions resolved on SDS‑PAGE gels and visualized by Coomassie brilliant blue staining.
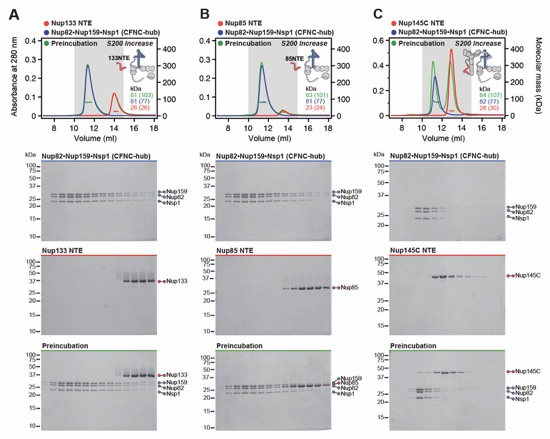
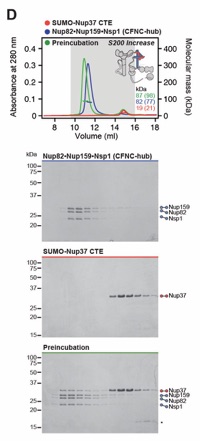
Fig. S9. Anchoring of the CFNC-hub to the CNC is mediated by Nup145CNTE and Nup37CTE. SEC‑MALS interaction analyses of CFNC-hub with (A) Nup133NTE, (B) Nup85NTE, (C) Nup145CNTE, and (D) SUMO-Nup37CTE, showing that Nup145C and Nup37 bind to the CFNC‑hub. SEC-MALS profiles of nup complexes are shown individually (red, blue) and after preincubation (green). SEC profiles were obtained using a Superdex 200 Increase 10/300 GL column. Measured molecular masses are indicated, with the respective theoretical masses shown in parentheses. Inset schematics display tested protein samples colored to match the corresponding chromatogram trace. Gray boxes indicate fractions resolved on SDS‑PAGE gels and visualized by Coomassie brilliant blue staining.
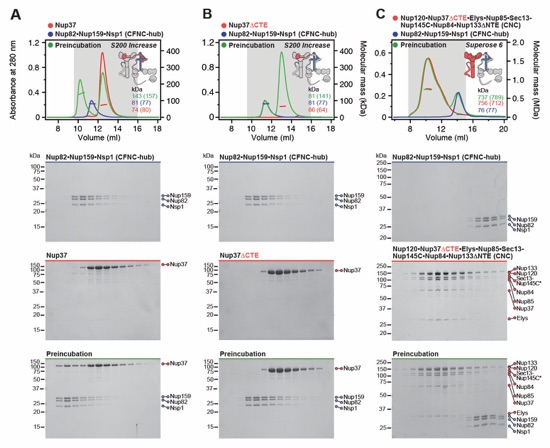
Fig. S10. Nup37CTE is necessary and sufficient for CFNC-hub binding. SEC-MALS interaction analysis of CFNC-hub with (A) Nup37, (B) Nup37ΔCTE, (C) Nup120•Nup37CTE•Elys•Nup85• Sec13‑Nup145C•Nup84•Nup133ΔNTE (CNCΔ37CTE). SEC-MALS profiles of nup complexes are shown individually (red, blue) and after preincubation (green). SEC profiles were obtained using (A, B) Superose 6 10/300 GL and (C) Superdex 200 10/300 GL columns. Measured molecular masses are indicated, with the respective theoretical masses shown in parentheses. Inset schematics display tested protein samples colored to match the corresponding chromatogram trace. Gray boxes indicate fractions resolved on SDS‑PAGE gels and visualized by Coomassie brilliant blue staining.
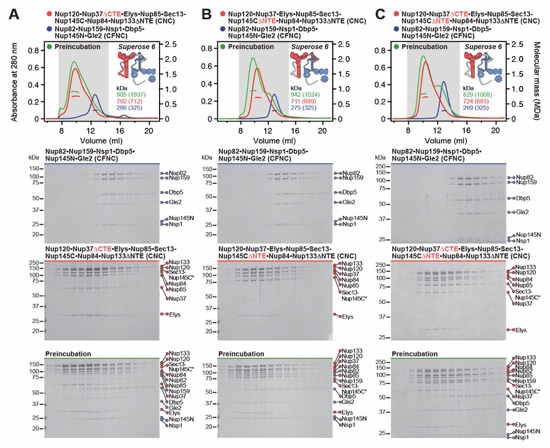
Fig. S11. Each intact CNC contains two distinct CFNC binding sites. SEC-MALS interaction analysis of intact CFNC with (A) CNCΔ37CTE, (B) CNCΔ145CNTE, and (C) CNCΔ37CTEΔ145CNTE, showing that the simultaneous removal of both Nup37CTE and Nup145CNTE disrupts the CFNC interaction, whereas their individual removal only weakens the CNC-CFNC interaction. The mildly sub‑stochiometric Dbp5 incorporation in the CNC‑CFNC complex results from the concentration limitation of the CNC. SEC-MALS profiles of nup complexes are shown individually (red, blue) and after preincubation (green). SEC profiles were obtained using a Superose 6 10/300 GL column. Measured molecular masses are indicated, with the respective theoretical masses shown in parentheses. Inset schematics display tested protein samples colored to match the corresponding chromatogram trace. Gray boxes indicate fractions resolved on SDS‑PAGE gels and visualized by Coomassie brilliant blue staining.
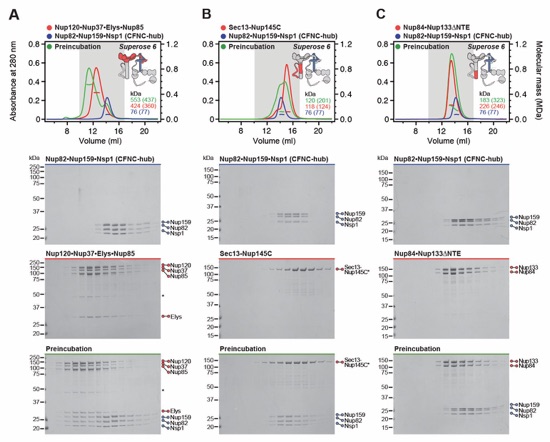
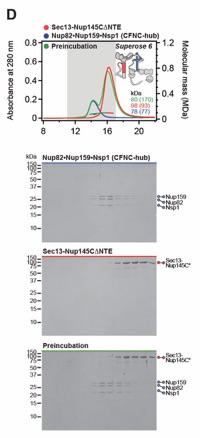
Fig. S12. Two CNC sub-complexes bind the CFNC-hub. SEC-MALS interaction analysis of CFNC‑hub with (A) Nup120•Nup37•Elys•Nup85, (B) Sec13‑Nup145C, (C) Nup84•Nup133ΔNTE, and (D) Sec13‑Nup145CΔNTE. SEC-MALS profiles of nup complexes are shown individually (red, blue) and after preincubation (green). SEC profiles were obtained using a Superose 6 10/300 GL column. Measured molecular masses are indicated, with the respective theoretical masses shown in parentheses. Inset schematics display tested protein samples colored to match the corresponding chromatogram trace. Gray boxes indicate fractions resolved on SDS‑PAGE gels and visualized by Coomassie brilliant blue staining.
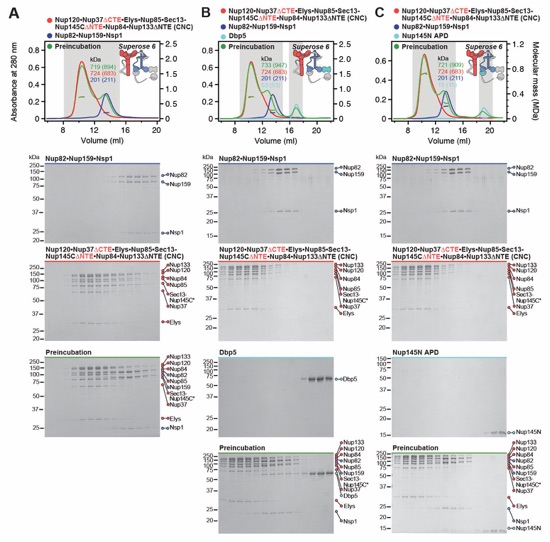
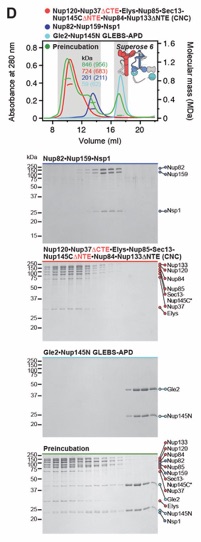
Fig. S13. Gle2•Nup145N contributes weakly to the CNC-CFNC interaction. SEC-MALS interaction analysis of CNCΔ37CTEΔ145CNTE with (A) Nup82•Nup159•Nsp1, (B) Nup82•Nup159•Nsp1 and Dbp5, (C) Nup82•Nup159•Nsp1 and Nup145NAPD, and (D) Nup82•Nup159•Nsp1 and Gle2•Nup145NGLEBS-APD, showing that in the absence of both Nup37CTE and Nup145CNTE CFNC binding sites, residual CNC binding is Gle2•Nup145NGLEBS-dependent. SEC-MALS profiles of nup complexes are shown individually (red, blue, cyan) and after preincubation (green). SEC profiles were obtained using a Superose 6 10/300 GL column. Measured molecular masses are indicated, with the respective theoretical masses shown in parentheses. Inset schematics display tested protein samples colored to match the corresponding chromatogram trace. Gray boxes indicate fractions resolved on SDS‑PAGE gels and visualized by Coomassie brilliant blue staining.
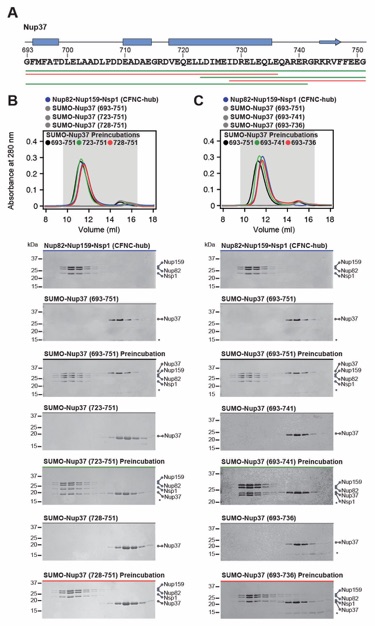
Fig. S14. Identification of a minimal Nup37CTE CFNC-hub binding region. (A) Primary sequence of Nup37CTE with predicted secondary structure elements. Colored lines indicate Nup37CTE N- and C‑terminal truncation fragments that were systematically tested for their ability to interact with the CFNC-hub, colored in green and red to indicate binding and no binding, respectively. Secondary structure predictions were conducted using Jpred4 (141). (B-C) SEC interaction analyses of CFNC-hub with (B) N-terminal SUMO-Nup37CTE truncations, or (C) C‑terminal SUMO-Nup37CTE truncations, mapping a minimal binding site to residues 723‑741. SEC profiles of nup complexes are shown individually (blue, gray) and after preincubation (black, red and green). SEC profiles were obtained using a Superdex 200 10/300 GL column. Gray boxes indicate fractions resolved on SDS‑PAGE gels and visualized by Coomassie brilliant blue staining.
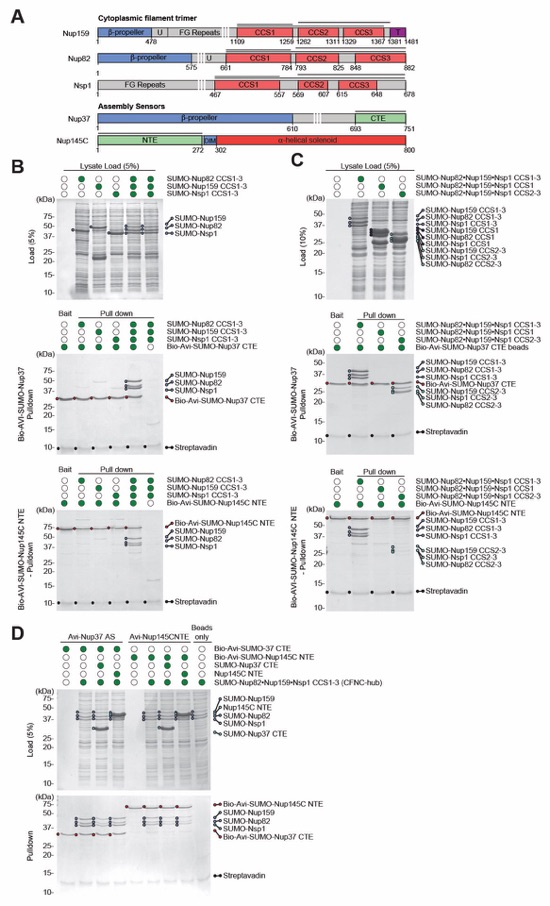
Fig. S15. Nup37CTE and Nup145CNTE encode assembly sensors for the CFNC-hub. (A) Domain architectures of Nup159, Nup82, Nsp1, Nup37, and Nup145C. Domains are drawn as horizontal boxes with residue numbers indicated and their observed or predicted folds colored. The black lines indicate the fragments used in the pull-down analysis. (B-D) Streptavidin pulldowns using Bio‑Avi‑SUMO‑Nup37CTE or Bio‑Avi‑SUMO‑Nup145CNTE baits with (B) bacterial lysates, containing either Nup82, Nup159, and Nsp1 CCS1‑3 fragments individually or a mixture of all three, demonstrating exclusive binding to the hetero-trimeric CFNC-hub, (C) bacterial lysates containing either the Nup82•Nup159•Nsp1 CCS1‑3 (CFNC-hub), or hetero-trimeric CCS1 and CCS2‑3 segments, demonstrating binding to CCS2-3 albeit to a lesser extent, and (D) bacterial lysates containing CFNC‑hub and a ~10 fold excess of purified SUMO-Nup37CTE or Nup145CNTE competitor, demonstrating mutually exclusive binding events. SDS‑PAGE gels are visualized by Coomassie brilliant blue staining.
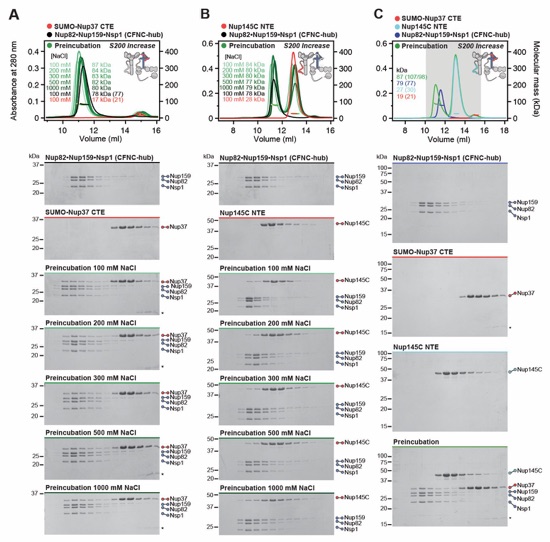
Fig. S16. Nup37CTE and Nup145CNTE bind CFNC-hub in a mutually exclusive fashion. SEC‑MALS interaction analysis of the CFNC-hub with (A) SUMO-Nup37CTE and (B) Nup145CNTE across increasing buffer NaCl concentrations, establishing the hydrophobic nature of both interactions. (C) SEC-MALS competition analysis of SUMO-Nup37CTE and Nup145CNTE binding to CFNC-hub, establishing mutually exclusive overlapping binding sites. SEC-MALS profiles of nup complexes are shown individually (red, blue, cyan, and black) and after preincubation (green). SEC profiles were obtained using a Superdex 200 Increase 10/300 GL column. Measured molecular masses are indicated, with the respective theoretical masses shown in parentheses. Inset schematics display tested protein samples colored to match the corresponding chromatogram trace. Gray boxes indicate fractions resolved on SDS‑PAGE gels and visualized by Coomassie brilliant blue staining.
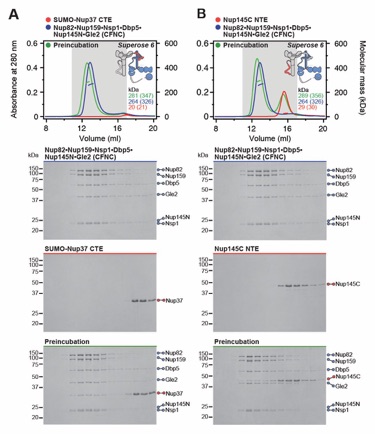
Fig. S17. Nup37CTE and Nup145CNTE bind the intact CFNC hetero-hexamer. SEC-MALS interaction analysis of CFNC with (A) SUMO-Nup37CTE and (B) Nup145CNTE. SEC-MALS profiles of nup complexes are shown individually (red, blue) and after preincubation (green). SEC profiles were obtained using a Superose 6 10/300 GL column. Measured molecular masses are indicated, with the respective theoretical masses shown in parentheses. Inset schematics display tested protein samples colored to match the corresponding chromatogram trace. Gray boxes indicate fractions resolved on SDS‑PAGE gels and visualized by Coomassie brilliant blue staining.
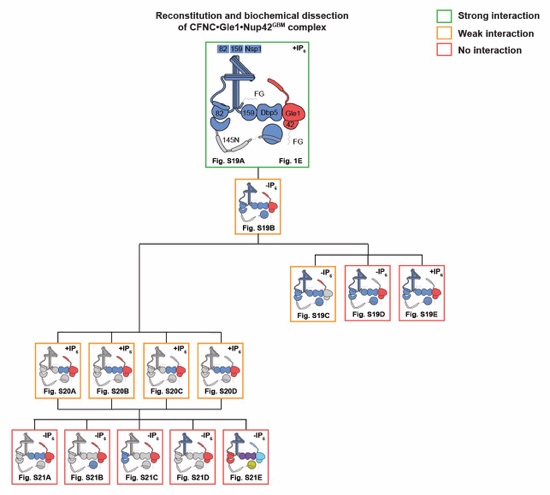
Fig. S18. Reconstitution and dissection strategy for the CFNC•Gle1•Nup42GBM hetero‑octamer. Summary of the SEC-MALS interaction analyses of the indicated figure panels. Each box in the flow chart represents a SEC‑MALS interaction experiment, involving individually purified Gle1•Nup42GBM and CFNC sub-complexes that were tested for their ability to form stochiometric complexes, colored by the experimental outcome; strong interaction (green), weak interaction (orange), no interaction (red). The inset schematics are colored to indicate the individually purified Gle1•Nup42GBM and CFNC sub‑complexes of each SEC‑MALS interaction experiment. Gray regions stipulate proteins omitted from each analysis and the presence and absence of IP6 in the interaction analyses are indicated.
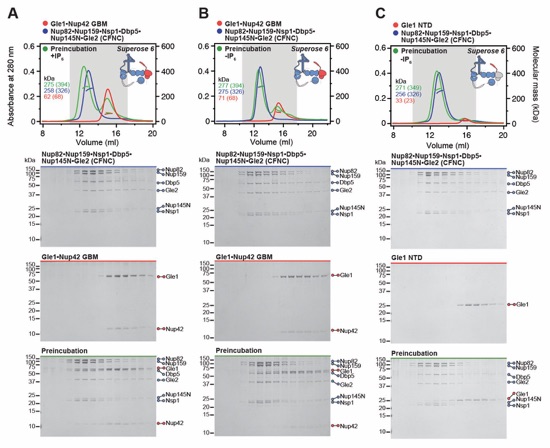
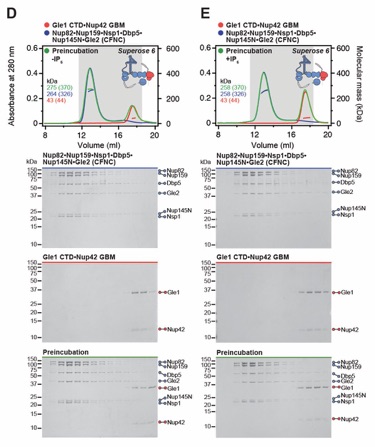
Fig. S19. Gle1•Nup42GBM binds the CFNC via a distributed binding site. (A, B) SEC-MALS interaction analysis of Gle1•Nup42GBM and CFNC in the (A) presence and (B) absence of IP6, demonstrating that formation of a stable stoichiometric CFNC•Gle1•Nup42GBM hetero-octamer is IP6-dependent (corresponding to Fig. 1E). (C, D) SEC-MALS interaction analyses of CFNC in the absence of IP6 with (C) Gle1NTD and (D) Gle1CTD•Nup42GBM, demonstrating that Gle1NTD contributes to CFNC binding. (E) SEC-MALS interaction analysis of CFNC in the presence of IP6 with Gle1CTD•Nup42GBM, showing that Gle1CTD is insufficient for CFNC binding. SEC-MALS profiles of nup complexes are shown individually (red and blue) and after preincubation (green). SEC profiles were obtained using a Superose 6 10/300 GL column. Measured molecular masses are indicated, with the respective theoretical masses shown in parentheses. Inset schematics display tested protein samples colored to match the corresponding chromatogram trace. Gray boxes indicate fractions resolved on SDS‑PAGE gels and visualized by Coomassie brilliant blue staining.
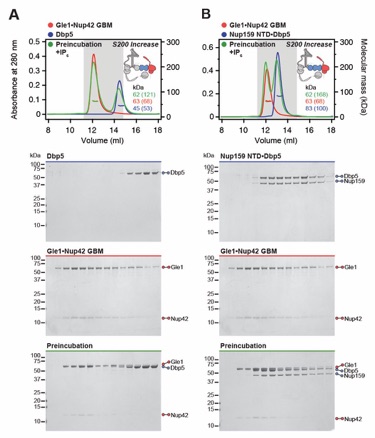
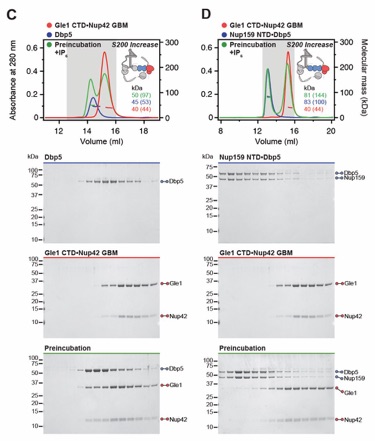
Fig. S20. Both Nup159NTD and Gle1NTD are dispensable for the Gle1•Nup42GBM-Dbp5 interaction. (A, B) SEC-MALS interaction analyses of Gle1•Nup42GBM in the presence of IP6 with (A) Dbp5 and (B) Nup159NTD•Dbp5, showing that Nup159NTD is dispensable for the Gle1•Nup42GBM-Dbp5 interaction. (C, D) SEC-MALS interaction analyses of Gle1CTD•Nup42GBM in the presence of IP6 with (C) Dbp5 and (D) Nup159NTD•Dbp5, showing that Gle1NTD is dispensable for the Gle1•Nup42GBM-Dbp5 interaction. SEC‑MALS profiles of nup complexes are shown individually (red, blue) and after preincubation (green). SEC profiles were obtained using a Superdex 200 Increase 10/300 GL column. Measured molecular masses are indicated, with the respective theoretical masses shown in parentheses. Inset schematics display tested protein samples colored to match the corresponding chromatogram trace. Gray boxes indicate fractions resolved on SDS‑PAGE gels and visualized by Coomassie brilliant blue staining.
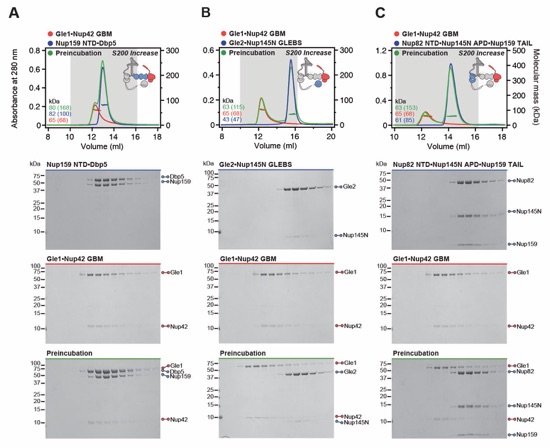
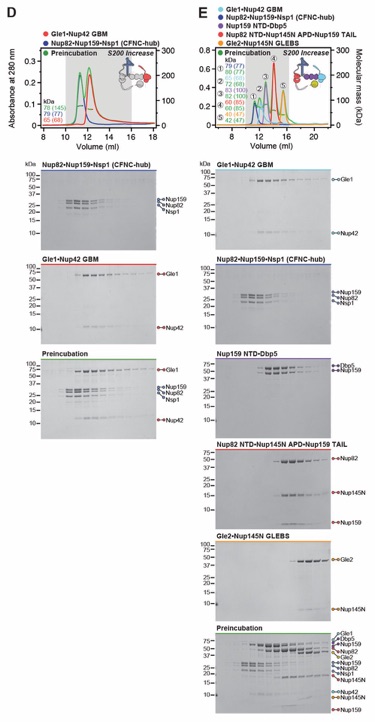
Fig. S21. A distributed CFNC binding site mediates the Gle1•Nup42GBM interaction. (A‑E) SEC‑MALS interaction analyses of Gle1•Nup42GBM in the absence of IP6 with (A) Nup159NTD•Dbp5, (B) Gle2•Nup145NGLEBS, (C) Nup82NTD•Nup145NAPD•Nup159TAIL, (D) CFNC‑hub, and (E) a mixture of all four CFNC subcomplexes, demonstrating that none of the four CFNC sub-complexes recapitulates the binding of intact CFNC. SEC‑MALS profiles of nup complexes are shown individually (red, blue, purple and yellow) and after preincubation (green). SEC profiles were obtained using a Superdex 200 Increase 10/300 GL column. Measured molecular masses are indicated, with the respective theoretical masses shown in parentheses. Inset schematics display tested protein samples colored to match the corresponding chromatogram trace. Gray boxes indicate fractions resolved on SDS‑PAGE gels and visualized by Coomassie brilliant blue staining.
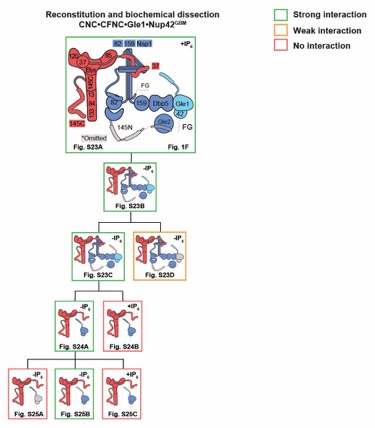
Fig. S22. Reconstitution and dissection strategy for the 16-protein CNC•CFNC•Gle1•Nup42GBM. Summary of the SEC-MALS interaction analyses of the indicated figure panels. Each box in the flow chart represents a SEC‑MALS interaction experiment, involving individually purified Gle1•Nup42GBM, CFNC, and CNC sub-complexes that were tested for their ability to form stochiometric complexes, colored by the experimental outcome; strong interaction (green), weak interaction (orange), no interaction (red). The inset schematics are colored to indicate the individually purified Gle1•Nup42GBM, CFNC, and CNC sub‑complexes of each SEC‑MALS interaction experiment. Gray regions stipulate proteins omitted from each analysis and the presence and absence of IP6 in the interaction analyses are indicated.
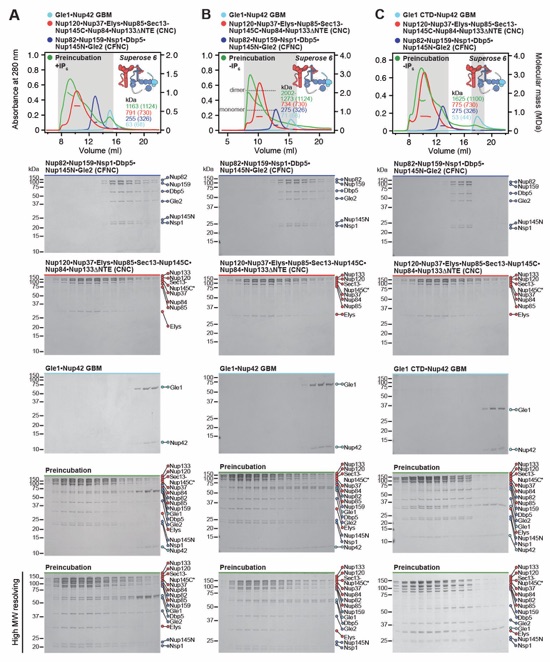
Fig. S23. Reconstitution of a 16-protein coat-cytoplasmic filament nup complex. (A) SEC‑MALS interaction analysis of CNC, CFNC, and Gle1•Nup42GBM in the presence of IP6, demonstrating the formation of an ~1,163 kDa monodisperse, stoichiometric 16-protein CNC•CFNC complex (corresponding to Fig. 1F). (B) SEC-MALS interaction analysis of CNC, CFNC, and Gle1•Nup42GBM in the absence of IP6, demonstrating the formation of a peak corresponding to a monomeric and a dimeric assembly state of the 16-protein CNC•CFNC complex with molecular masses ranging from ~2,002 to ~1,273 kDa. (C, D) SEC‑MALS analysis of the CNC•CFNC interaction with (C) Gle1CTD•Nup42GBM and (D) Gle1NTD in the absence of IP6, demonstrating Gle1CTD• Nup42GBM incorporation into the CNC-CFNC complex and partial dimer formation, whereas the Gle1NTD exhibits barely detectable binding. SEC-MALS profiles of nup complexes are shown individually (red, blue and cyan) and after preincubation (green). SEC profiles were obtained using a Superose 6 10/300 GL column. Measured molecular masses are indicated, with the respective theoretical masses shown in parentheses. Inset schematics display tested protein samples colored to match the corresponding chromatogram trace. Gray boxes indicate fractions resolved on SDS‑PAGE gels and visualized by Coomassie brilliant blue staining.
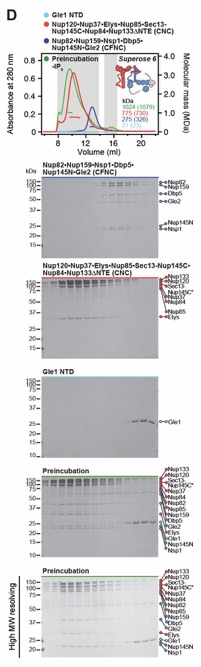
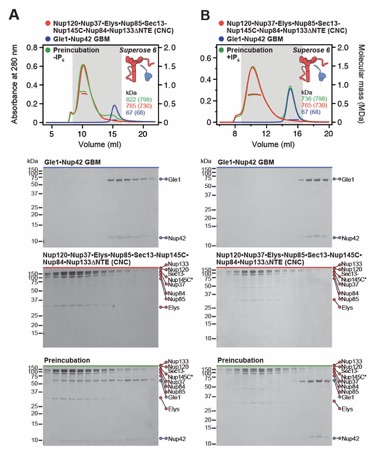
Fig. S24. Gle1•Nup42GBM binds to the CNC in an IP6-dependent fashion. (A, B) SEC-MALS analyses of the interaction between Gle1•Nup42GBM and CNC (A) in the absence and (B) presence of IP6, demonstrating the formation of a stoichiometric monodisperse ~822 kDa Gle1•Nup42GBM•CNC complex exclusively in the absence of IP6. SEC‑MALS profiles of nup complexes are shown individually (red, blue) and after preincubation (green). SEC profiles were obtained using a Superose 6 10/300 GL column. Measured molecular masses are indicated, with the respective theoretical masses shown in parentheses. Inset schematics display tested protein samples colored to match the corresponding chromatogram trace. Gray boxes indicate fractions resolved on SDS‑PAGE gels and visualized by Coomassie brilliant blue staining.
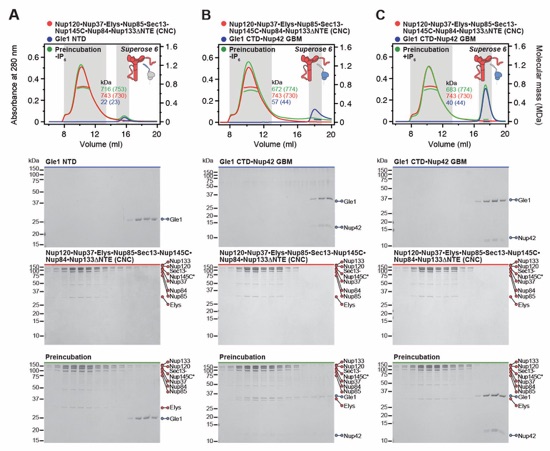
Fig. S25. Gle1NTD is dispensable for the Gle1•Nup42GBM-CNC interaction. (A, B) SEC-MALS interaction analyses of the CNC in the absence of IP6 with (A) Gle1NTD and (B) Gle1CTD•Nup42GBM, showing that Gle1CTD•Nup42GBM binds the CNC, whereas no binding is detected for Gle1NTD. (C) SEC‑MALS interaction analysis of the CNC in the presence of IP6 with Gle1CTD•Nup42GBM, demonstrating that the presence of IP6 prevents binding of Gle1CTD•Nup42 GBM to CNC. SEC‑MALS profiles of nup complexes are shown individually (red, blue) and after preincubation (green). SEC profiles were obtained using a Superose 6 10/300 GL column. Measured molecular masses are indicated, with the respective theoretical masses shown in parentheses. Inset schematics display tested protein samples colored to match the corresponding chromatogram trace. Gray boxes indicate fractions resolved on SDS‑PAGE gels and visualized by Coomassie brilliant blue staining.
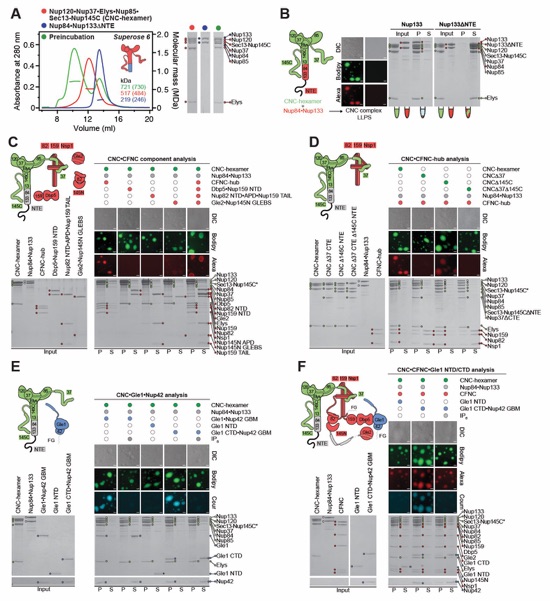
Fig. S26. Liquid-liquid phase separation analysis of coat-cytoplasmic filament nup interactions. (A) SEC-MALS interaction analysis of Nup120•Nup37•Elys•Nup85• Sec13‑Nup145C (CNC-hexamer; red) with Nup84•Nup133ΔNTE (blue), and their preincubation (green), showing the formation of a stoichiometric monodisperse CNC complex in the absence of Nup133NTE. SEC profiles were obtained using a Superose 6 10/300 GL column. Measured molecular masses are indicated, with the respective theoretical masses shown in parentheses. SDS‑PAGE gels strips of the peak fractions are shown. (B) Mixing CNC-hexamer (green) with Nup84•Nup133 (red) results in formation of liquid-liquid phase separation (LLPS) condensates, dependent on the presence of Nup133NTE. (C) LLPS interaction assay, assessing the incorporation of the four CFNC subcomplexes (CFNC-hub, Dbp5•Nup159NTD, Nup82NTD•Nup145NAPD•Nup159TAIL, and Gle2•Nup145NGLEBS) into the CNC‑LLPS condensate, identifying that only CFNC-hub enters. (D) LLPS interaction assay, assessing CFNC-hub incorporation into LLPS condensates, generated by CNC variants lacking either Nup37CTE, Nup145CNTE, or both assembly sensors, demonstrating that CFNC-hub entry is dependent on both assembly sensors. (E) LLPS interaction assay, assessing the incorporation of Gle1•Nup42GBM, Gle1NTD, and Gle1CTD•Nup42GBM, into the CNC-LLPS condensate. Whereas Gle1NTD fails to incorporate, both Gle1•Nup42GBM and Gle1CTD•Nup42GBM enter the condensate, but only in the absence of IP6. (F) LLPS interaction assay, assessing Gle1NTD and Gle1CTD•Nup42GBM incorporation into CNC‑CFNC‑LLPS condensates. As for the CNC-LLPS, Gle1NTD fails to incorporate, whereas the condensate incorporation of Gle1CTD•Nup42GBM occurs only in the absence of IP6. These results establish that the CFNC-CNC interaction is mediated by the Nup37CTE and Nup145CNTE assembly sensors and show that Gle1•Nup42GMB incorporation requires both Gle1NTD and Gle1CTD•Nup42GMB in the presence of IP6. The fluorescence microscopy analyses utilized dye labeled proteins, CNC-hexamer and its variants (Bodipy; green), CFNC and its sub-complexes (Alexa Fluor 647; red), and Gle1•Nup42GBM and its fragments (Coumarin; cyan). Pelleted CNC condensate phase (P) and soluble (S) fractions were analyzed by SDS‑PAGE and visualized by Coomassie brilliant blue staining. All experiments were repeated at least three times. Scale bars are 10 μm.
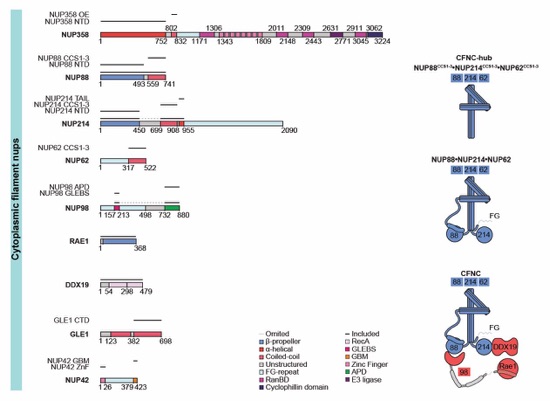
Fig. S27. H. sapiens nucleoporin fragments. Domain architectures of the human cytoplasmic filament nups. Domains are drawn as horizontal boxes with residue numbers indicated and their observed or predicted folds colored according to the legend. The black lines indicate the fragments used throughout the text. Dashed lines indicate regions excluded from expression constructs. As a reference, schematics of nup complexes are shown on the right.
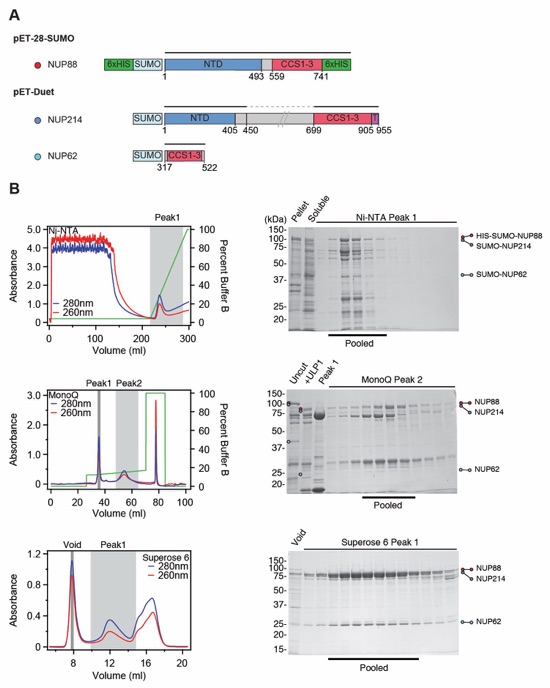
Fig. S28. Purification of the human NUP88•NUP214•NUP62 hetero-trimer. (A) Domain boundaries of the purified nups are shown with black lines indicating the construct boundaries of NUP88, NUP214, and NUP62 in our bacterial expression constructs. The dashed line indicates a central unstructured region in NUP214 that was excluded. (B) NUP88•NUP214•NUP62 hetero‑trimer purification. Sequential chromatography purification steps are shown from top to bottom with the employed columns indicated. The gray boxes indicate fractions that were resolved on SDS-PAGE gels and visualized by Coomassie staining. Pooled fractions are indicated with a black bar below the SDS-PAGE gels. For details of the buffer conditions see Table S5.
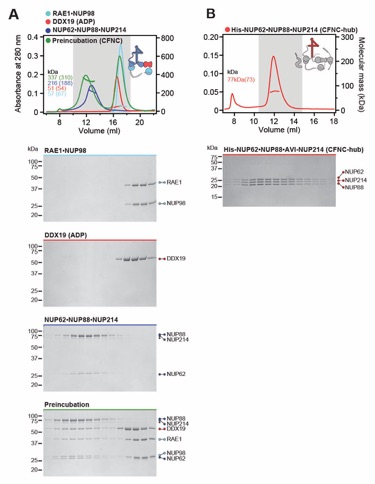
Fig. S29. Reconstitution of the evolutionarily conserved human CFNC hetero-hexamer. (A) SEC‑MALS interaction analysis showing the biochemical reconstitution of the ~330 kDa hetero‑hexameric CFNC (green) from NUP62•NUP88•NUP214 (blue), RAE1•NUP98 (cyan), and DDX19(ADP) (red) (corresponding to Fig. 2C). SEC profiles were obtained on a Superose 6 10/300 GL column. (B) SEC-MALS analysis of the hetero-trimeric NUP62•NUP88•NUP214 CCS1-3 complex (CFNC‑hub). SEC profile was obtained on a Superdex 200 10/300 GL column. Measured molecular masses are indicated, with the respective theoretical masses shown in parentheses. The inset schematics are colored to indicate the CFNC sub‑complexes of each SEC-MALS interaction experiment, with gray domains and regions omitted from the experiment. Gray boxes indicate fractions resolved on SDS‑PAGE gels and visualized by Coomassie brilliant blue staining.
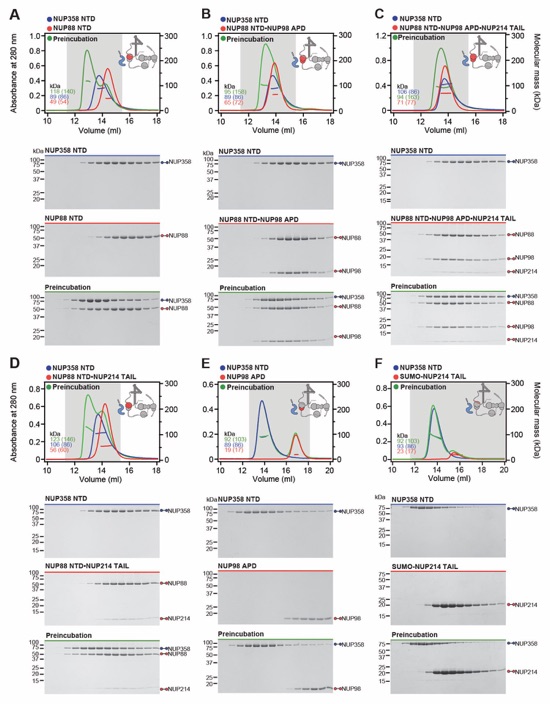
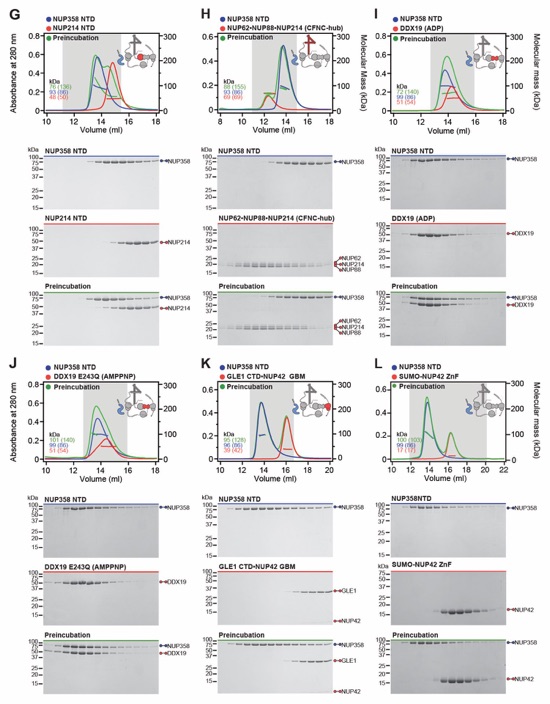
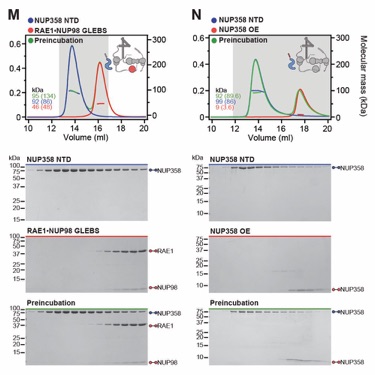
Fig. S30. Systematic interaction analyses of NUP358NTD with human CF nup fragments. SEC-MALS interaction analyses of NUP358NTD with (A) Nup88NTD, (B) NUP88NTD•NUP98APD, (C) NUP88NTD•NUP98APD•NUP214TAIL, (D) NUP88NTD•NUP214TAIL, (E) NUP98APD, (F) SUMO‑NUP214TAIL, (G) NUP214NTD, (H) CFNC-hub, (I) DDX19 (ADP), (J) DDX19 E243Q (AMPPNP), (K) GLE1CTD•NUP42, (L) SUMO‑NUP42ZnF, (M) RAE1•NUP98GLEBS, and (N) NUP358OE. Interactions were observed between Nup358NTD and Nup88NTD, Nup88NTD-Nup98APD, and Nup88NTD-Nup98APD-Nup214TAIL. SEC-MALS profiles of nup complexes are shown individually (red and blue) and after preincubation (green). SEC profiles were obtained using a Superdex 200 10/300 GL column. Measured molecular masses are indicated, with the respective theoretical masses shown in parentheses. Inset schematics display tested protein samples colored to match the corresponding chromatogram trace. Gray boxes indicate fractions resolved on SDS‑PAGE gels and visualized by Coomassie brilliant blue staining.
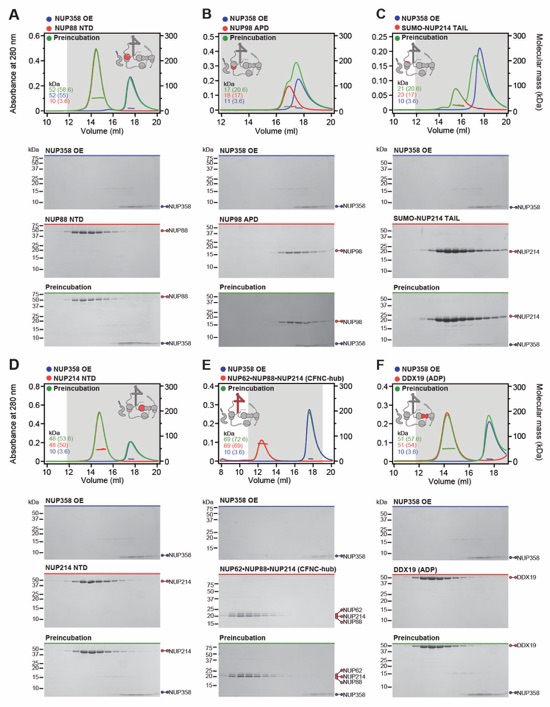
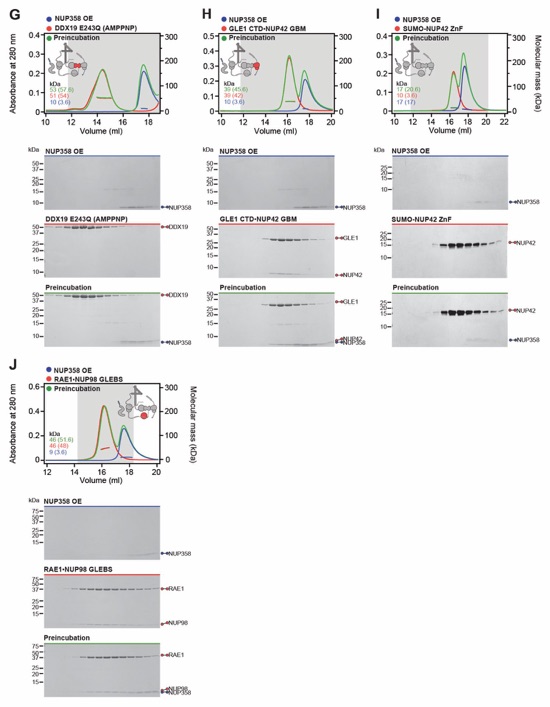
Fig. S31. Systematic interaction analyses of NUP358OE with human CF nup fragments. SEC‑MALS interaction analyses of NUP358OE with (A) Nup88NTD, (B) NUP98APD, (C) SUMO‑NUP214TAIL, (D) NUP214NTD, (E) CFNC-hub, (F) DDX19(ADP), (G) DDX19(AMPPNP) E243Q, (H) GLE1CTD•NUP42, (I) SUMO‑NUP42ZnF, and (J) RAE1•NUP98GLEBS. SEC-MALS profiles of nup complexes are shown individually (red and blue) and after preincubation (green). SEC profiles were obtained using a Superdex 200 10/300 GL column. Measured molecular masses are indicated, with the respective theoretical masses shown in parentheses. Inset schematics display tested protein samples colored to match the corresponding chromatogram trace. Gray boxes indicate fractions resolved on SDS‑PAGE gels and visualized by Coomassie brilliant blue staining.
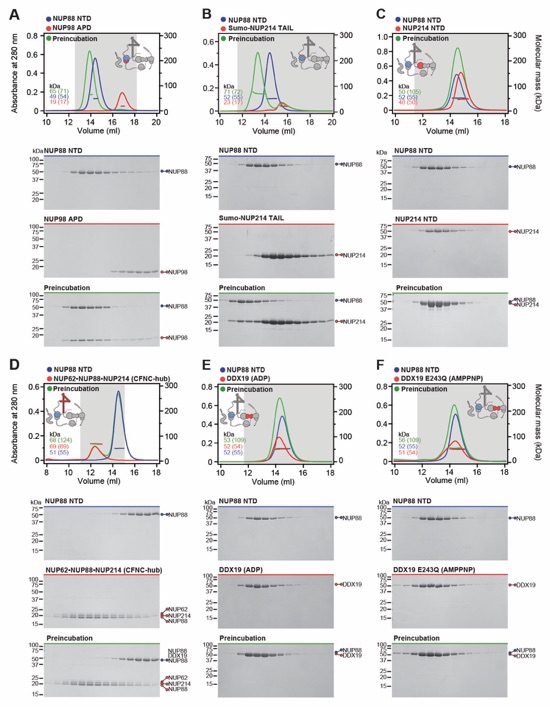
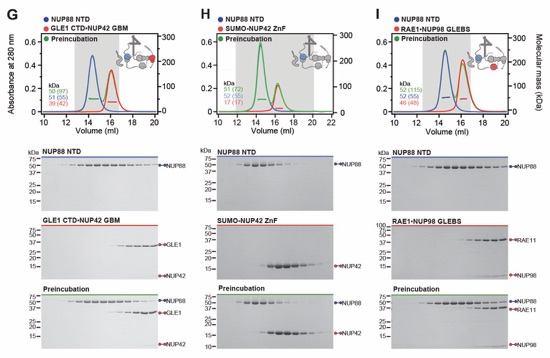
Fig. S32 Systematic interaction analyses of NUP88NTD with human CF nup fragments. SEC‑MALS interaction analyses of NUP88NTD with (A) NUP98APD, (B) SUMO‑NUP214TAIL, (C) NUP214NTD, (D) CFNC‑hub, (E) DDX19(ADP), (F) DDX19(AMPPNP) E243Q, (G) GLE1CTD•NUP42, (H) SUMO‑NUP42ZnF, and (I) RAE1•NUP98GLEBS. SEC-MALS profiles of nup complexes are shown individually (red and blue) and after preincubation (green). SEC profiles were obtained using a Superdex 200 10/300 GL column. Measured molecular masses are indicated, with the respective theoretical masses shown in parentheses. Inset schematics display tested protein samples colored to match the corresponding chromatogram trace. Gray boxes indicate fractions resolved on SDS‑PAGE gels and visualized by Coomassie brilliant blue staining.
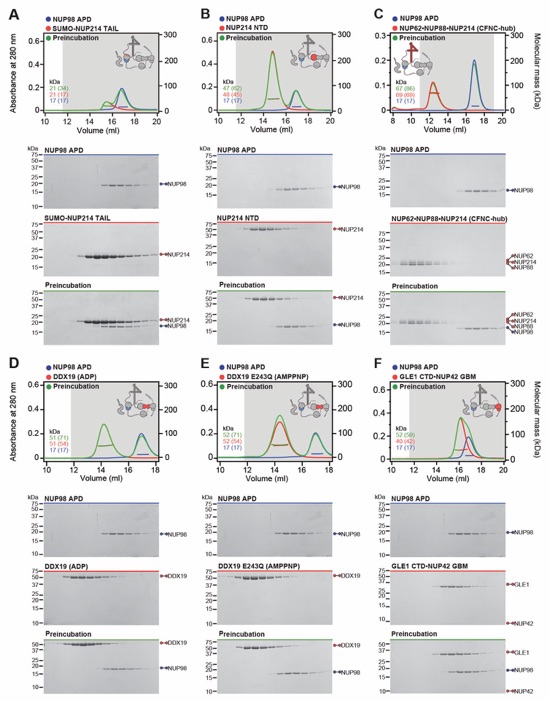
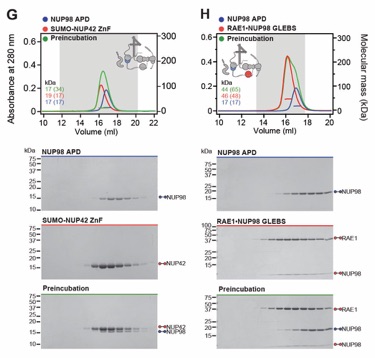
Fig. S33 Systematic interaction analyses of NUP98APD with human CF nup fragments. SEC‑MALS interaction analyses of NUP98APD with (A) SUMO‑NUP214TAIL, (B) NUP214NTD, (C) CFNC‑hub, (D) DDX19(ADP), (E) DDX19(AMPPNP) E243Q, (F) GLE1CTD•NUP42, (G) SUMO‑NUP42ZnF, and (H) RAE1•NUP98GLEBS. SEC-MALS profiles of nup complexes are shown individually (red and blue) and after preincubation (green). SEC profiles were obtained using a Superdex 200 10/300 GL column. Measured molecular masses are indicated, with the respective theoretical masses shown in parentheses. Inset schematics display tested protein samples colored to match the corresponding chromatogram trace. Gray boxes indicate fractions resolved on SDS‑PAGE gels and visualized by Coomassie brilliant blue staining.
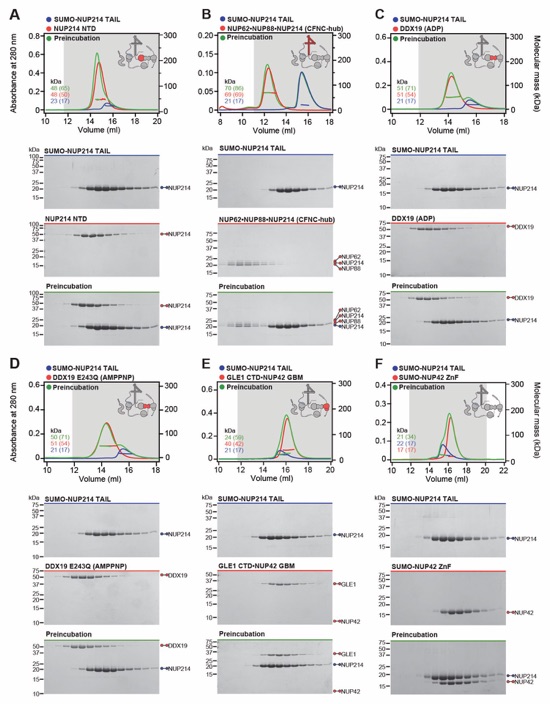
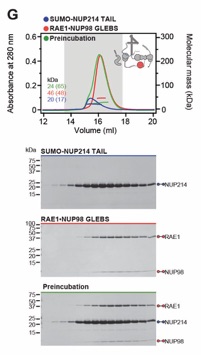
Fig. S34. Systematic interaction analyses of NUP214TAIL with human CF nup fragments. SEC-MALS interaction analyses of SUMO‑NUP214TAIL with (A) NUP214NTD, (B) CFNC-hub, (C) DDX19(ADP), (D) DDX19(AMPPNP) E243Q, (E) GLE1CTD•NUP42, (F) SUMO‑NUP42ZnF, and (G) RAE1•NUP98GLEBS. SEC-MALS profiles of nup complexes are shown individually (red and blue) and after preincubation (green). SEC profiles were obtained using a Superdex 200 10/300 GL column. Measured molecular masses are indicated, with the respective theoretical masses shown in parentheses. Inset schematics display tested protein samples colored to match the corresponding chromatogram trace. Gray boxes indicate fractions resolved on SDS‑PAGE gels and visualized by Coomassie brilliant blue staining.
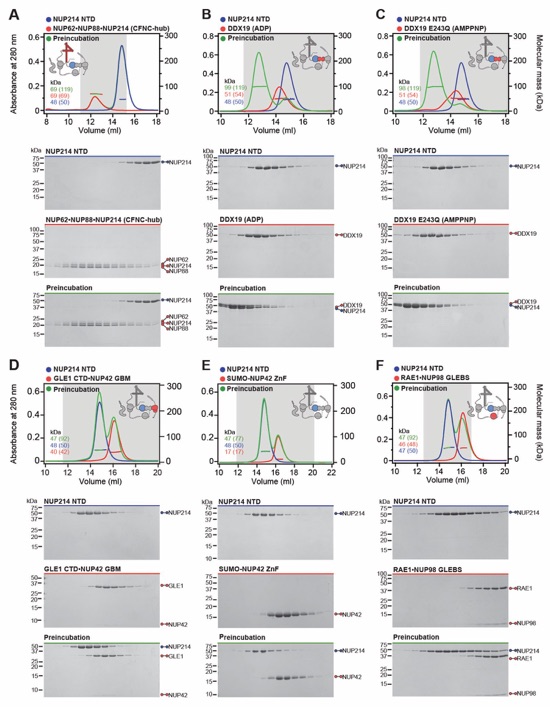
Fig. S35. Systematic interaction analyses of NUP214TAIL with human CF nup fragments. SEC-MALS interaction analyses of NUP214NTD with (A) CFNC-hub, (B) DDX19(ADP), (C) DDX19(AMPPNP) E243Q, (D) GLE1CTD•NUP42, (E) SUMO‑NUP42ZnF, and (F) RAE1•NUP98GLEBS. SEC-MALS profiles of nup complexes are shown individually (red and blue) and after preincubation (green). SEC profiles were obtained using a Superdex 200 10/300 GL column. Measured molecular masses are indicated, with the respective theoretical masses shown in parentheses. Inset schematics display tested protein samples colored to match the corresponding chromatogram trace. Gray boxes indicate fractions resolved on SDS‑PAGE gels and visualized by Coomassie brilliant blue staining.
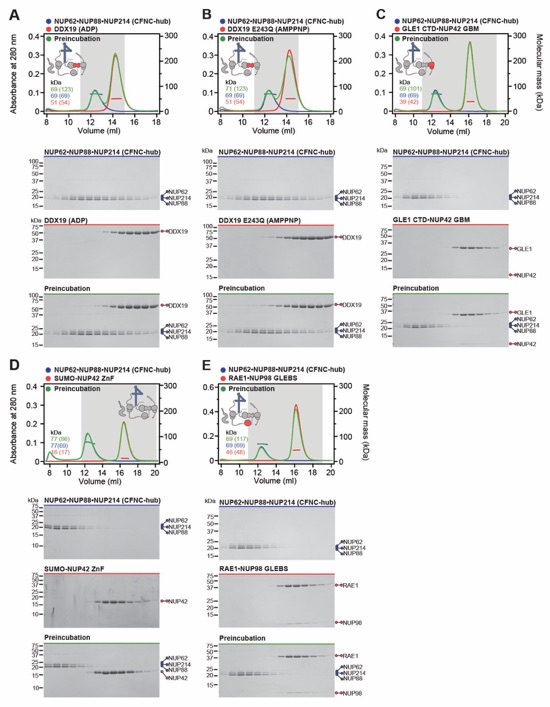
Fig. S36. Systematic interaction analyses of NUP214TAIL with human CF nup fragments. SEC-MALS interaction analyses of CFNC-hub with (A) DDX19 (ADP), (B) DDX19(AMPPNP) E243Q, (C) GLE1CTD•NUP42, (D) SUMO‑NUP42ZnF, and (E) RAE1•NUP98GLEBS. SEC-MALS profiles of nups complexes are shown individually (red and blue) and after preincubation (green). SEC profiles were obtained using a Superdex 200 10/300 GL column. Measured molecular masses are indicated, with the respective theoretical masses shown in parentheses. Inset schematics display tested protein samples colored to match the corresponding chromatogram trace. Gray boxes indicate fractions resolved on SDS‑PAGE gels and visualized by Coomassie brilliant blue staining.
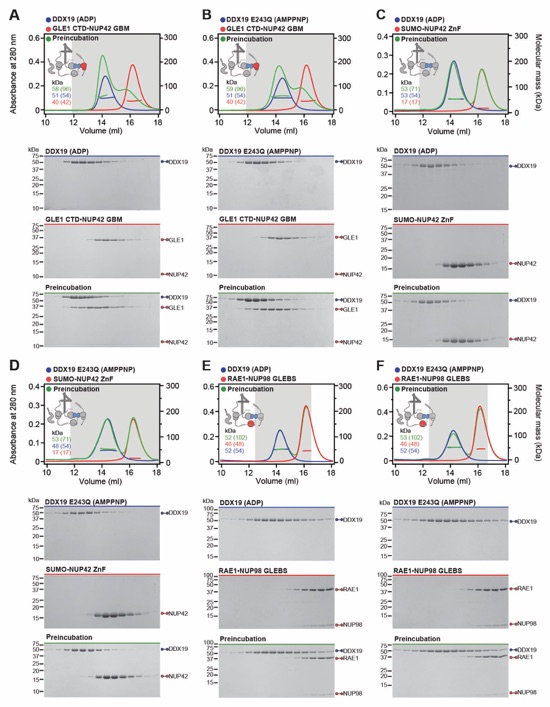
Fig. S37. Systematic interaction analyses of DDX19 with human CF nup fragments. SEC‑MALS interaction analyses of DDX19 (ADP) or DDX19(AMPPNP) E243Q with (A, B) GLE1CTD•NUP42, (C, D) SUMO‑NUP42ZnF, and (E, F) RAE1•NUP98GLEBS. SEC-MALS profiles of nup complexes are shown individually (red and blue) and after preincubation (green). SEC profiles were obtained using a Superdex 200 10/300 GL column. Measured molecular masses are indicated, with the respective theoretical masses shown in parentheses. Inset schematics display tested protein samples colored to match the corresponding chromatogram trace. Gray boxes indicate fractions resolved on SDS‑PAGE gels and visualized by Coomassie brilliant blue staining.
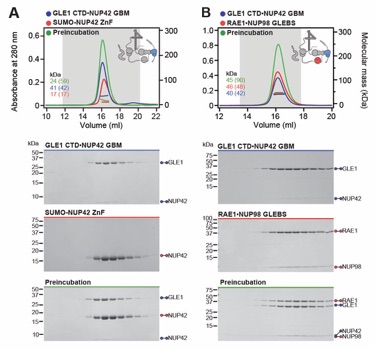
Fig. S38. Systematic interaction analyses of GLE1CTD•NUP42 with human CF nup fragments. SEC‑MALS interaction analyses of GLE1CTD•NUP42 with (A) SUMO‑NUP42ZnF, and (B) RAE1•NUP98GLEBS. SEC-MALS profiles of nup complexes are shown individually (red and blue) and after preincubation (green). SEC profiles were obtained using a Superdex 200 10/300 GL column. Measured molecular masses are indicated, with the respective theoretical masses shown in parentheses. Inset schematics display tested protein samples colored to match the corresponding chromatogram trace. Gray boxes indicate fractions resolved on SDS‑PAGE gels and visualized by Coomassie brilliant blue staining.
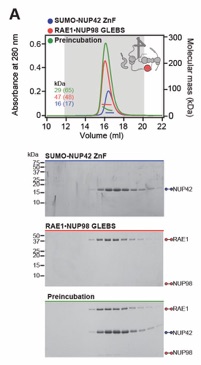
Fig. S39. Systematic interaction analyses of NUP42ZnF and RAE1•NUP98GLEBS with human CF nup fragments. SEC-MALS interaction analysis of SUMO‑NUP42ZnF with (A) RAE1•NUP98GLEBS. SEC-MALS profiles of SUMO-NUP42ZnF and RAE1•NUP98GLEBS are shown individually (blue and red, respectively) and after preincubation (green). SEC profiles were obtained using a Superdex 200 10/300 GL column. Measured molecular masses are indicated, with the respective theoretical masses shown in parentheses. Inset schematics display tested protein samples colored to match the corresponding chromatogram trace. Gray boxes indicate fractions resolved on SDS‑PAGE gels and visualized by Coomassie brilliant blue staining.
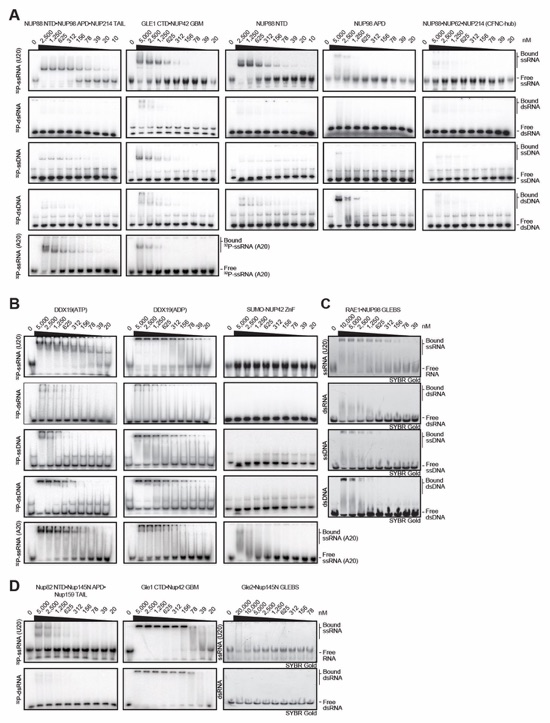
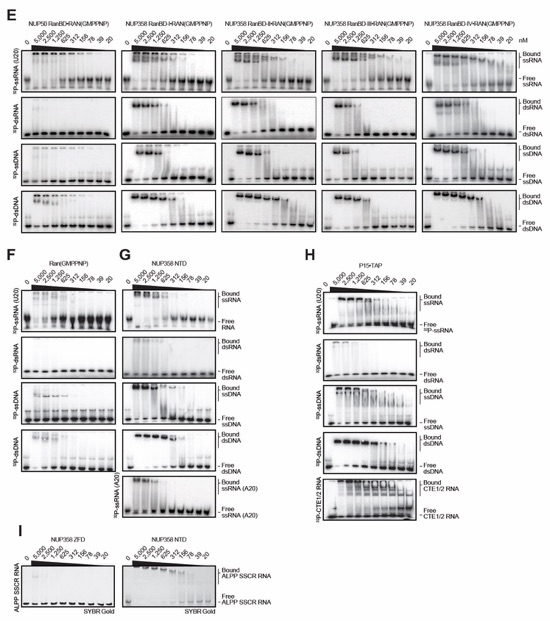
Fig. S40. Evolutionary conservation of cytoplasmic filament nup RNA binding properties. Cytoplasmic filament nup domains and complexes were assayed for binding to single stranded (ss) and double stranded (ds) RNA and DNA probes by electrophoretic mobility shift assay (EMSA); ssRNA (U20), dsRNA (28-nt hairpin), ssDNA (34-nt DNA oligonucleotide), dsDNA (34-bp hybridized DNA oligonucleotides) and ssRNA (A20). Final concentrations of protein and complexes are indicated. EMSA titration of (A-C) human CFNC nup domains and subcomplexes, (D) C. thermophilum CFNC subcomplexes, (E) NUP358 and NUP50 RanBDs pre-complexed with Ran(GMPPNP), (F) Ran(GMPPMP), and (G) NUP358NTD. (H) EMSA titration of mRNA export complex P15•TAP with ss/ds RNA and DNA and CTE1/2 RNA, a commonly used viral RNA probe for P15•TAP. (I) EMSA titrations of NUP358NTD and NUP358ZFD with ALPPSSCR RNA.
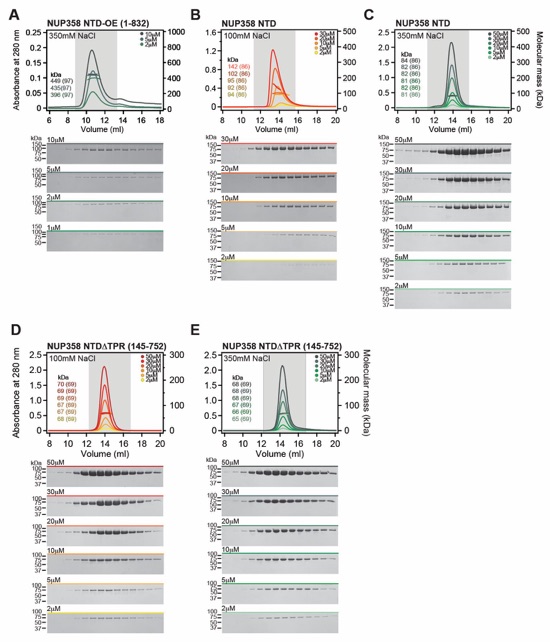
Fig. S41. Biochemical analysis of oligomerization properties of NUP358 fragments. (A) SEC-MALS analysis of NUP358NTD-OE at the indicated increasing protein concentrations. The measured molecular masses increase from ~400 kDa to ~450 kDa, indicating the formation of a concentration-dependent oligomer, ranging from a homo-tetramer or -pentamer. (B, C) SEC‑MALS oligomerization analyses of NUP358NTD at the indicated increasing protein concentrations and buffer conditions. NUP358NTD forms a concentration-dependent monomer‑dimer mixture that is interrupted by 350 mM NaCl. (D, E) SEC‑MALS oligomerization analyses of NUP358NTDΔTPR at the indicated increasing protein concentrations and buffer conditions. NUP358NTDΔTPR is monomeric in all buffer conditions tested, establishing that NUP358TPR contributes to NUP358NTD dimerization. Measured molecular masses are indicated, with the respective theoretical masses shown in parentheses. Gray boxes indicate fractions resolved on SDS‑PAGE gels and visualized by Coomassie brilliant blue staining.
Fig. S42. Structural and biochemical characterization of NUP358OE. (A) Experimental electron density map after density modification of NUP358OE phased with the sulfur-SAD anomalous X-ray diffraction data, contoured at 1.0 σ. (B, C) SEC-MALS oligomerization analysis of NUP358OE, at the indicated increasing protein concentrations and buffer conditions. NUP358OE forms oligomeric states ranging from homo‑dimer to -tetramer independent of the buffer condition. (D, E) SEC‑MALS oligomerization analysis of NUP358OE LIQIML mutant (L811A, I814A, Q817A, I821A, M825A, and L828A), at the indicated increasing protein concentrations and buffer conditions. The measured molecular masses at all proteins concentrations and both buffer conditions correspond to a monomeric species, demonstrating that the LIQIML mutation abolishes the oligomeric behavior of NUP358OE. (F, G) SEC-MALS oligomerization analysis of NUP358NTD-OE LIQIML mutant, at the indicated increasing protein concentrations and buffer conditions. The LIQIML mutation abolishes the homo‑tetramer or -pentamer formation, yielding a dynamic monomer‑dimer equilibrium, as observed for NUP358NTD. In the 350 mM NaCl buffer, the NUP358NTD-OE LIQIML mutant is a monodisperse monomer at all protein concentrations tested. SEC profiles were obtained using a Superdex 200 10/300 GL column. Measured molecular masses are indicated, with the respective theoretical masses shown in parentheses. Gray boxes indicate fractions resolved on SDS‑PAGE gels and visualized by Coomassie brilliant blue staining.
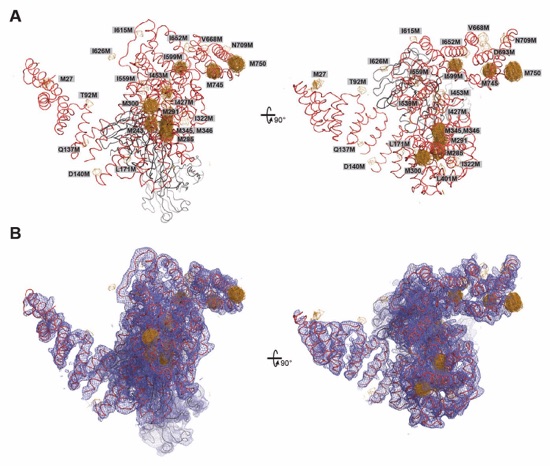
Fig. 43. Determination of the NUP358NTD•sAB-14 crystal structure and sequence assignment. (A) The NUP358NTD•sAB‑14 structure is shown in coil representation and overlayed with anomalous difference Fourier maps (contoured at 3.5 σ), calculated from SeMet-SAD X-ray diffraction data obtained from SeMet-labeled crystals of 17 different methionine mutants. Together with the endogenous methionines of the wildtype complex, this analysis identified a total of 26 selenium positions, providing a marker for the unambiguous assignment of the NUP358NTD sequence register. A 90º-rotated view is shown on the right. For clarity, the second NUP358NTD•sAB-14 copy in the asymmetric unit is omitted. (B) Final 2|Fo|‑|Fc| electron density map contoured at 1.0 σ.
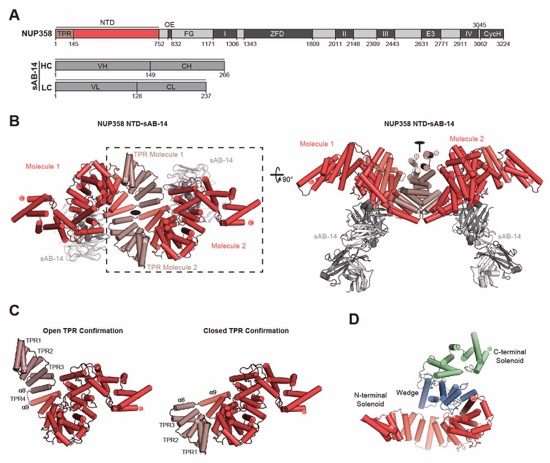
Fig. S44. Crystal structure of NUP358NTD bound by sAB-14. (A) Domain structure of NUP358 and sAB-14 light and heavy chains drawn as horizontal boxes with residue numbers indicated. Black lines indicate the boundaries of the crystallized fragments. (B) Cartoon representation of the NUP358NTD•sAB‑14 co-crystal structure dyad of the P6522 lattice, illustrating the swap of the N-terminal TPR subdomain between symmetry related NUP358NTD molecules. A 90°‑rotated view highlights sAB-14 binding to the convex surface of NUP358NTD. (C) Comparison of open and closed conformations of NUP358NTD. The crystallographic dimer reveals two alternative conformations of NUP358NTD, in which NUP358TPR either forms a continuous solenoid (open), or folds back, separating TPR4 and forming electrostatic interactions with HEAT repeats 5-7 of the N-terminal solenoid (closed). The open conformation adopts an overall S-shaped architecture, whereas the closed conformation is a compact particle. (D) Cartoon representation colored to indicate the three α-helical solenoids that compose the NUP358NTD giving rise to an overall S‑shape molecule; N-terminal α‑helical solenoid (red), α‑helical wedge (blue), C-terminal α‑helical solenoid (green).
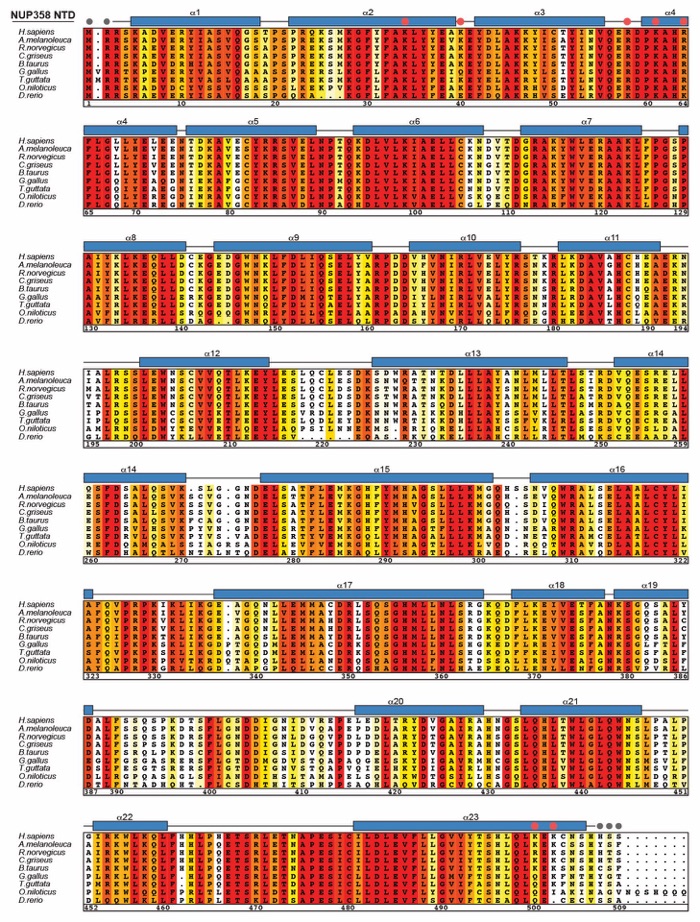
Fig. S45. Multispecies sequence alignment of NUP358NTD. Sequences of nine metazoan species were aligned and colored according to similarity using the BLOSUM62 matrix from white (less than 40% similarity), through yellow (60% similarity), to red (100% identity). The numbering is according to the H. sapiens protein. The secondary structure is indicated above the sequences as rectangles (α-helices) and lines (unstructured regions), residues unresolved in the crystal structure are indicated by gray dots. Yellow dots indicate residues found in sequence variants associated with acute necrotizing encephalopathy 1 (ANE1). Red dots indicate the seven residues that are substituted by alanine in the 2R5K mutation that abolishes the NUP88NTD and ALPPSSCR RNA interactions.
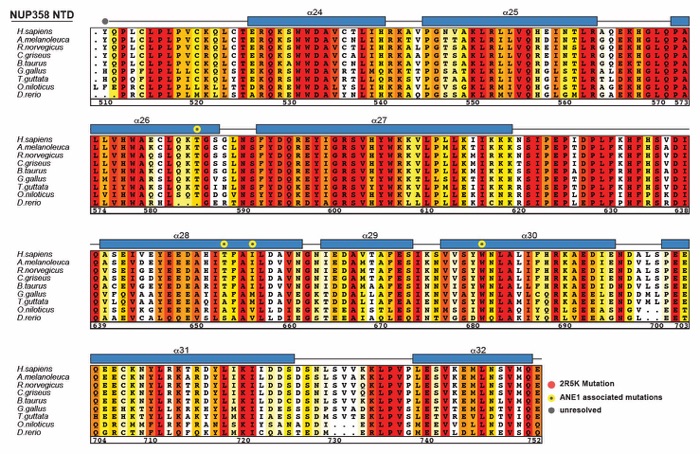
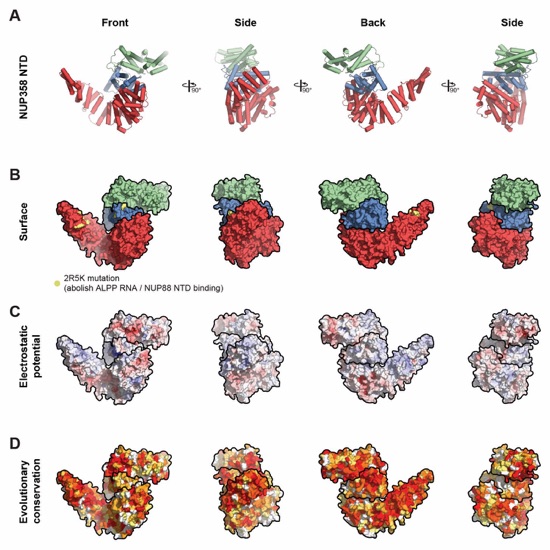
Fig. S46. Surface properties of NUP358NTD. (A) Cartoon representation of NUP358NTD with N‑terminal α‑helical solenoid in red, α‑helical wedge domain in blue, and C-terminal α‑helical solenoid in green. (B) Surface representation of NUP358NTD colored as in (A). Residues mutated to alanine in the 2R5K mutation are indicated in yellow (C) Surface representation colored according to electrostatic potential from red (-10 kBT/e) to blue (+10 kBT/e). (D) Surface representation colored according to sequence conservation based on alignment in fig. S45. The NUP358NTD structure is shown from four different orientations related by 90° rotations around the vertical axis.
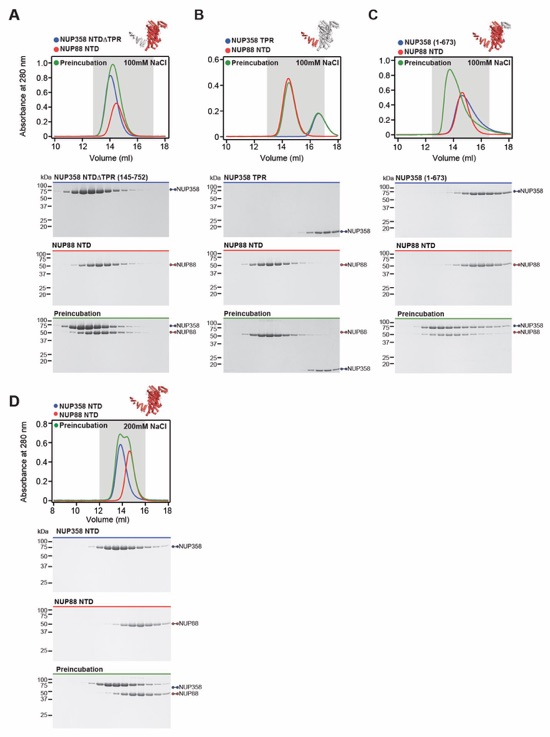
Fig. S47. Biochemical characterization of the NUP358NTD-NUP88NTD interaction. (A-C) SEC interaction analyses of NUP88NTD with (A) NUP358NTDΔTPR, (B) NUP358TPR, and (C) NUP3581‑673, demonstrating that NUP358TPR is necessary but insufficient for NUP88NTD binding. (D) SEC analysis of NUP88NTD with NUP358NTD in a buffer containing 200 mM NaCl, revealing the salt-sensitive nature of the interaction. SEC profiles of NUP358NTD variants (blue) and NUP88NTD (red) are shown individually and after their preincubation (green). SEC profiles were obtained using a Superdex 200 10/300 GL column. Gray boxes indicate fractions resolved on SDS‑PAGE gels and visualized by Coomassie brilliant blue staining.
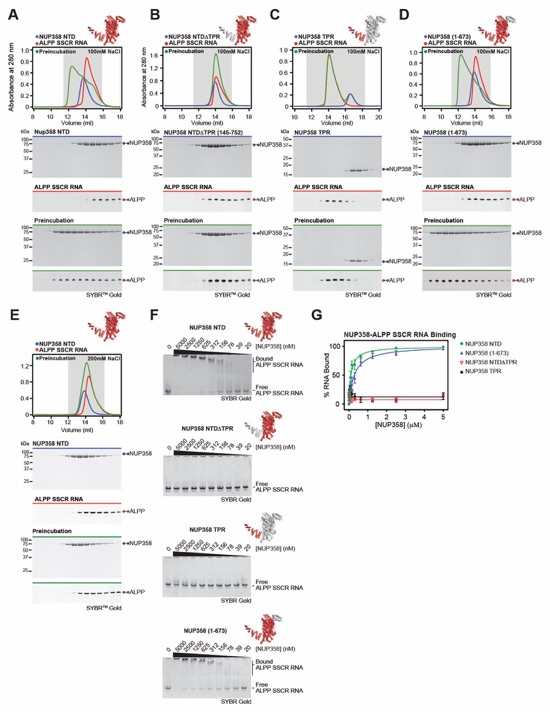
Fig. S48. Biochemical characterization of the NUP358NTD-ALPPSSCR RNA interaction. (A‑D) SEC interaction analyses of ALPPSSCR RNA with (A) NUP358NTD, (B) NUP358NTDΔTPR, (C) NUP358TPR, and (D) NUP3581-673, demonstrating that NUP358TPR is necessary but insufficient for ALPPSSCR RNA binding. (E) SEC analysis of ALPPSSCR RNA with NUP358NTD in a buffer containing 200 mM NaCl, revealing the salt-sensitive nature of the interaction. SEC profiles of NUP358 variants (blue) and ALPPSSCR RNA (red) are shown individually and after their preincubation (green). SEC profiles were obtained using a Superdex 200 10/300 GL column. Gray boxes indicate fractions resolved on SDS‑PAGE and 0.5X TBE urea-PAGE denaturing gels and visualized by Coomassie brilliant blue and SYBR Gold staining, respectively. (F) EMSA titrations against ALPPSSCR RNA are shown for each NUP358 variant used in (A-D), corroborating the SEC interaction results. (G) Quantitation of RNA binding of three independent experiment and plotted against protein concentration. Error bars represent standard error.
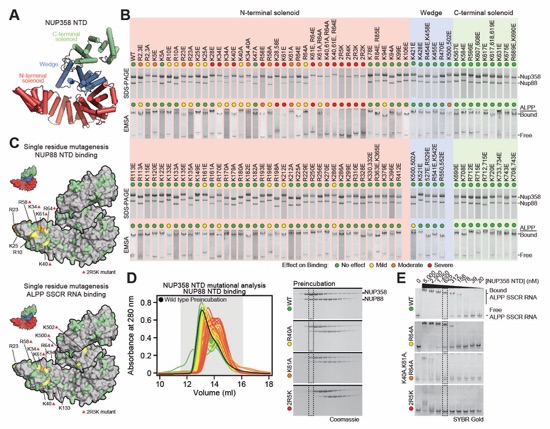
Fig. S49. Identification of NUP88NTD and ALPPSSCR RNA binding sites on the NUP358NTD surface. (A) Cartoon representation of NUP358NTD. (B) 106 NUP358NTD surface mutants were tested for their interaction with NUP88NTD and ALPPSSCR RNA by SEC and EMSA, respectively. SDS-PAGE gel strips from each NUP358NTD mutant, corresponding to the peak fraction from the wildtype SEC interaction, were visualized by Coomassie brilliant blue staining. EMSA gel strips for each NUP358NTD mutant at 625 nM concentration, were visualized by SYBR Gold staining. The colored dots indicate the effect on binding of the mutations. (C) Surface representations of NUP358NTD with saturating mutagenesis residues colored according to their effect on NUP88NTD and ALPPSSCR RNA binding. Red triangles indicate residues of the 2R5K combination mutant, which abolishes the interactions with both NUP88NTD and ALPPSSCR RNA. (D) SEC profiles of NUP88NTD interactions with NUP358NTD mutants are overlayed and colored according to their effect on NUP88NTD binding. Gray boxes indicate fractions resolved on SDS‑PAGE gels for representative interactions in each category of binding. (E) Full EMSA titrations are shown for representative interactions in each category of binding. Dashed lines indicate SDS-PAGE and EMSA lanes shown in panel (B). Combination mutations are referred to as 2R5K (K34A, K40A, R58A, K61A, R64A, K500A, and K502A), 2R4K (K40A, R58A, K61A, R64A, K500A, and K502A), 2R3K (K34A, K40A, R58A, K61A, and R64A), and 2R2K (K40A, R58A, K61A, and R64A).
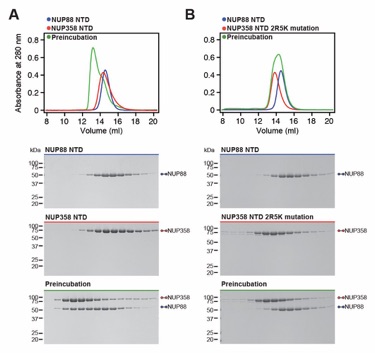
Fig. S50. NUP358NTD 2R5K combination mutant abolishes NUP88NTD binding. (A, B) SEC interaction analysis of NUP88NTD with (A) NUP358NTD and (B) the NUP358NTD 2R5K combination mutant (K34A, K40A, R58A, K61A, R64A, K500A, and K502A). The 2R5K combination mutation abolishes the NUP358NTD-NUP88NTD interaction. SEC profiles of NUP358NTD variants (blue) and NUP88NTD (red) are shown individually and after their preincubation (green). SEC profiles were obtained using a Superdex 200 10/300 GL column. Gray boxes indicate fractions resolved on SDS‑PAGE gels and visualized by Coomassie brilliant blue staining.
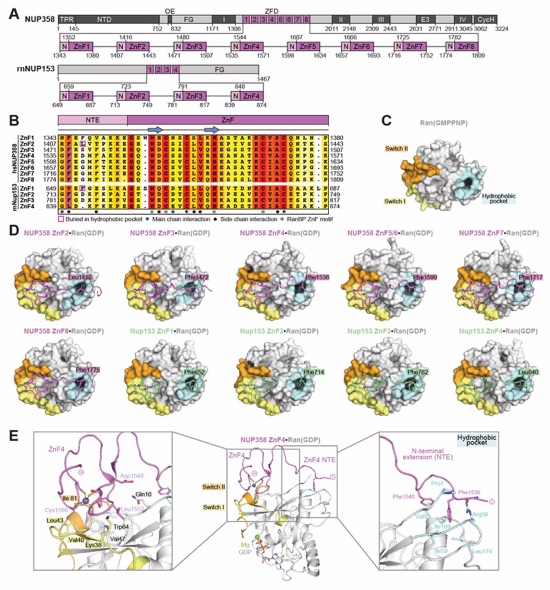
Fig. S51. Crystal structures of NUP358ZnF•Ran(GDP) and NUP153ZnF•Ran(GDP) complexes. (A) Domain structures of NUP358 and NUP153 drawn as horizontal boxes with residue numbers indicated. (B) Sequence alignment of the eight NUP358 and four R. norvegicus rnNUP153 ZnFs colored according to the BLOSUM62 weighting algorithm from white (less than 40% similarity), through yellow (60% similarity), to red (100% identity). (C) Surface representation of Ran(GMPPNP) from the NUP358RanBD‑IV•Ran crystal structure, highlighting the switch I (yellow), switch II (orange), and the nucleotide-independent hydrophobic pocket (cyan). (D) Co-crystal structures of six NUP358ZnF•Ran(GDP) and four rnNUP153ZnF•Ran(GDP) complexes are shown. The ZnFs and Ran(GDP) are shown in cartoon and surface representation, respectively. In all structures, a hydrophobic residue of each NTE occupies Ran’s nucleotide-independent hydrophobic pocket. (E) Magnified views of NUP358ZnF4•Ran(GDP) illustrating Ran’s interactions with the ZnF motif and NTE.
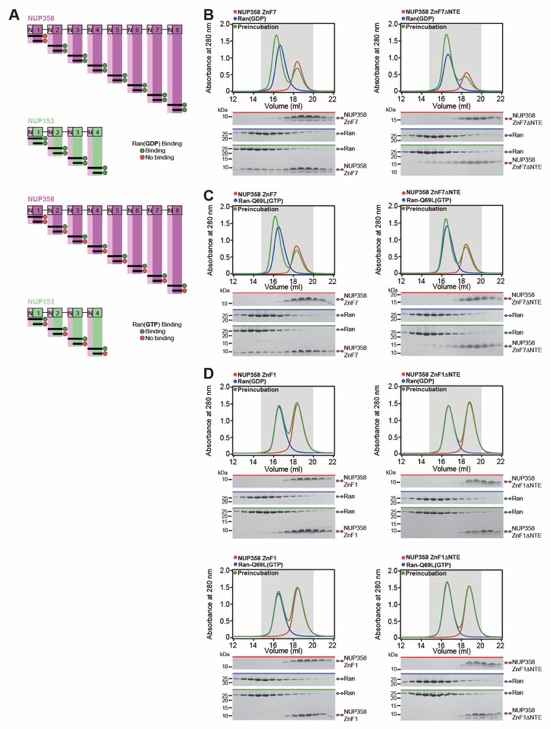
Fig. S52. Biochemical analysis of the Ran interaction with NUP358/NUP153 ZnF modules. (A) Summary of the Ran(GDP) binding properties of the twelve NUP358/NUP153 ZnF modules. Apart from NUP358ZnF1, for which no binding is detected, the remaining eleven ZnF modules bind Ran(GDP) irrespective of the presence of the NTE. (B) Representative SEC interaction analysis of RAN(GDP) with NUP358ZnF7 in the absence or presence of the NTE. (C) Summary of the Ran(GTP) binding properties of the twelve NUP358/NUP153 ZnF modules. Apart from NUP358ZnF1, for which no binding is detected, Ran(GTP) binding of the remaining eleven ZnF modules is dependent on the presence of the NTE. (D) SEC interaction analyses of NUP358ZnF1 with Ran(GDP) and Ran(GTP), showing no binding irrespective of the presence of the NTE.
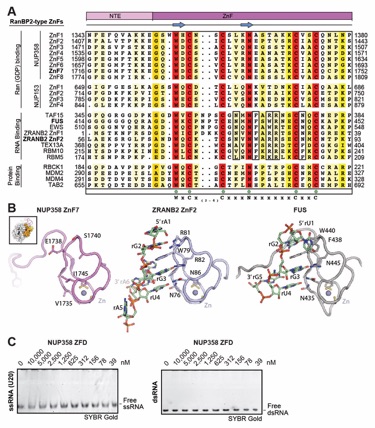
Fig. S53. NUP358 ZFD does not bind to single- or double-stranded RNA. (A) Sequence alignment of the twelve NUP358/NUP153 ZnF modules with representative members of the RanBP2 ZnF family with established RNA or protein binding properties, colored according to the BLOSUM62 weighting algorithm from white (less than 40% similarity) through yellow (60% similarity) to red (100% identity). Essential RNA binding residues are highlighted by a black box. RanBP2-type zinc finger motif residues are indicated by green dots. (B) Structures of NUP358ZnF7, ZRANB2ZnF•ssRNA (PDB ID 3G9Y) (143), and FUSZnF•ssRNA (PDB ID 6G99) (144) are shown, illustrating the absence of residues required for RNA binding. Inset indicates NUP358ZnF7 orientation in comparison to Ran(GDP). (C) EMSA titration of NUP358ZFD with ssRNA and dsRNA visualized with SYBR Gold stain, demonstrating the absence of RNA binding properties.
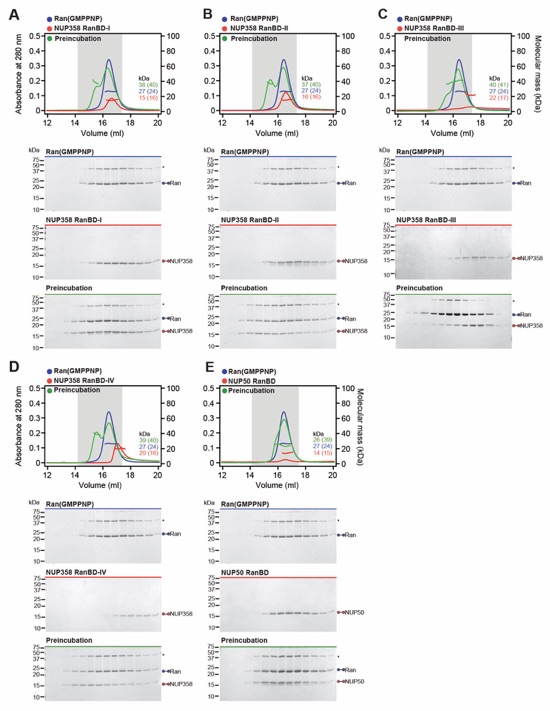
Fig. S54. Biochemical analysis of the Ran interaction with NUP358/NUP50 RanBDs. (A‑E) SEC‑MALS interaction analyses of Ran(GMPPNP) with (A) NUP358RanBD-I, (B) NUP358RanBD-II, (C) NUP358RanBD-III, (D) NUP358RanBD‑IV, and (E) NUP50RanBD. SEC profiles of RanBDs (blue) and Ran(GMPPNP) red are shown individually and after their preincubation (green). Measured molecular masses are indicated, with the respective theoretical masses shown in parentheses. Gray boxes indicate fractions resolved on SDS‑PAGE gels and visualized by Coomassie brilliant blue staining. Asterisks indicate oligomeric Ran species, arising from boiling in SDS-loading dye.
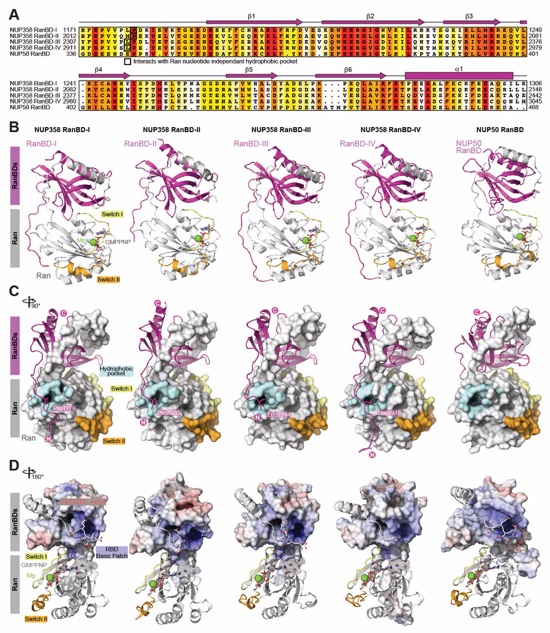
Fig. S55. Crystal structures of NUP358/NUP50RanBD•Ran(GMPPNP). (A) Sequence alignment of the NUP358/NUP50 RanBD, colored according to the BLOSUM62 weighting algorithm from white (less than 40% similarity), through yellow (60% similarity), to red (100% identity). The secondary structure is indicated above the sequences as rectangles (a-helices), arrows (β‑strands), and lines (unstructured regions). (B) Co-crystal structures of the five NUP358/NUP50RanBD•Ran(GMPPNP) complexes shown in cartoon representation. (C) 90º‑rotated views of all five complexes illustrating the location of Ran’s nucleotide‑independent hydrophobic pocket that accommodates a hydrophobic residue of all four NUP358RanBD, an interaction not observed in the NUP50RanBD complex. (D) 180º-rotated views of all five complexes highlighting the interaction of the DEDDDL motif of Ran with the basic patch found on each RanBD. The RanBD surface representation is colored according to electrostatic potential from red (‑10 kBT/e) to blue (+10 kBT/e).
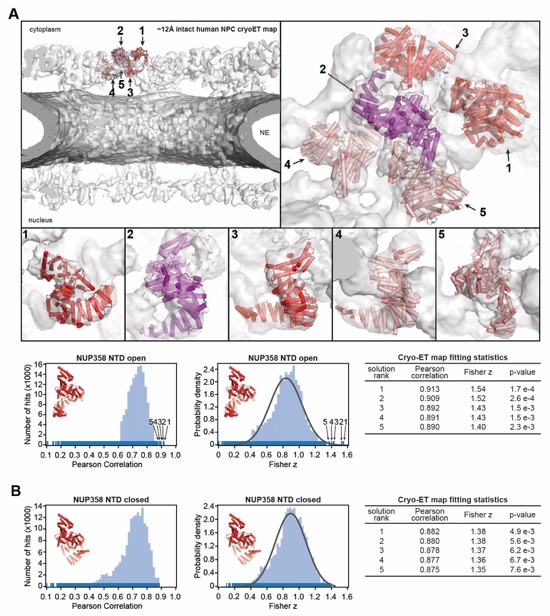
Fig. S56. Docking of the NUP358NTD structure into an ~12Å cryo-ET map of the intact human NPC. (A) The open conformation NUP358NTD crystal structure was quantitatively docked into the ~12 Å sub‑tomogram averaged cryo-ET map of the intact human NPC (46). Placed unique solutions are shown in cartoon representation with their rank indicated, whereas the cryo-ET map is rendered as a transparent isosurface. Solutions are viewed from a central cross-section of the intact NPC (left), from a closeup view from above the cytoplasmic face (right), or individually (bottom). Isosurfaces of the nuclear envelope and the NPC are colored dark and light gray, respectively. Rug plots (blue) and histograms (light blue) of Pearson correlation scores and derived Fisher z scores, fit with a normalized Gaussian curve (black), from a global search with 1 million random initial placements, are shown. Arrows and corresponding numbers indicate the rank of accepted solutions. A table summary of the accepted solutions fitting statistics, along with one-tailed p-values calculated from the Fisher z score distribution, is shown. (B) The same analysis as in (A) was applied to the closed conformation NUP358NTD crystal structure. Unlike with the open conformation, the docking solutions identified for the closed conformation of NUP358NTD crystal structure did not segregate to high confidence.
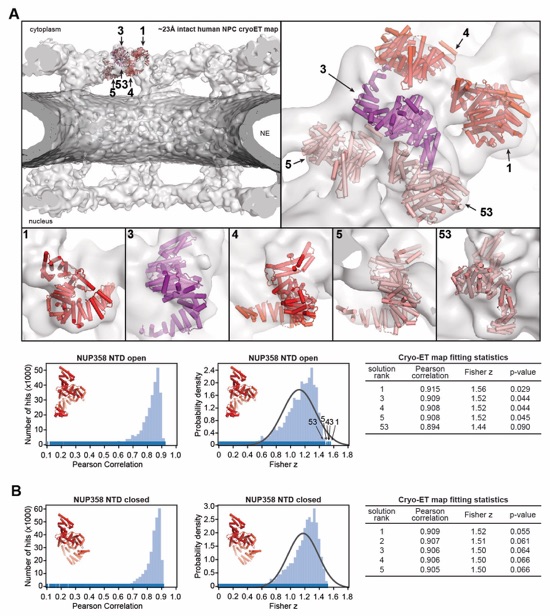
Fig. S57. Docking of the NUP358NTD structure into an ~23Å cryo-ET map of the intact human NPC. (A)The open conformation NUP358NTD crystal structure was quantitatively docked into the ~23 Å sub‑tomogram averaged cryo-ET map of the intact human NPC (44). Placed unique solutions are shown in cartoon representation with their rank indicated, whereas the cryo-ET map is rendered as a transparent isosurface. Solutions are viewed from a central cross-section of the intact NPC (left), from a closeup view from above the cytoplasmic face (right), or individually (bottom). Isosurfaces of the nuclear envelope and the NPC are colored dark and light gray, respectively. Rug plots (blue) and histograms (light blue) of Pearson correlation scores and derived Fisher z scores, fit with a normalized Gaussian curve (black), from a global search with 1 million random initial placements, are shown. Arrows and corresponding numbers indicate the rank of accepted solutions. A table summary of the accepted solutions fitting statistics, along with one-tailed p-values calculated from the Fisher z score distribution, is shown. (B) The same analysis as in (A) was applied to the closed conformation NUP358NTD crystal structure. Unlike with the open conformation, the docking solutions identified for the closed conformation of NUP358NTD crystal structure did not segregate to high confidence.
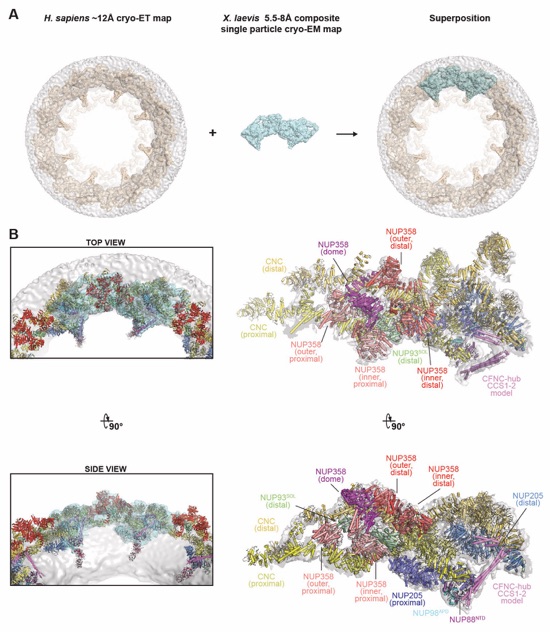
Fig. S58. Docking of the CF nups into the anisotropic composite single particle cryo-EM map of the X. laevis cytoplasmic face protomer. (A) (A) An anisotropic ~8 Å composite single particle cryo-EM map of the X. laevis cytoplasmic face protomer (light cyan; EMD-0909) (45) was superposed to the ~12 Å cryo-ET map of the intact human NPC (wheat; EMD-14322) (46). Maps and nuclear envelope (gray) are rendered as isosurfaces. (B) The superposition of the two maps placed the docked cytoplasmic outer ring and cytoplasmic face asymmetric nup structures, shown in cartoon representation, into the composite single particle cryo-EM map of the X. laevis cytoplasmic face protomer (left). The fit of the structures was subsequently locally optimized against the fully explained X. laevis cryo-EM map (right).
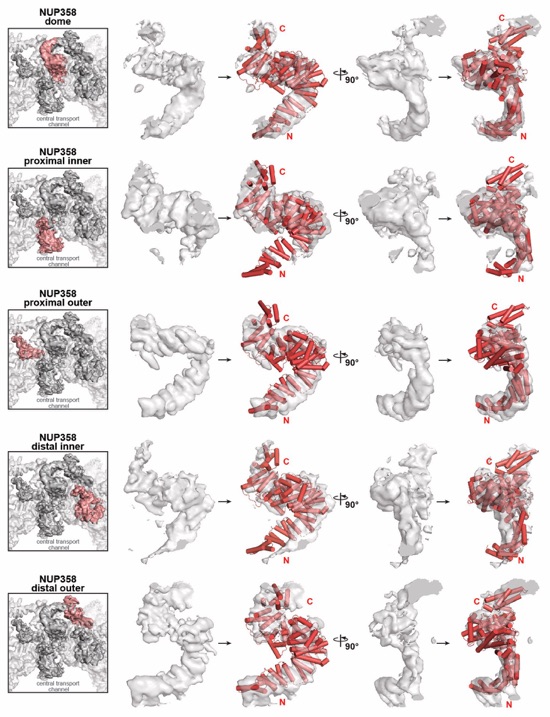
Fig. S59. Identifying five NUP358NTD copies in the X. laevis cytoplasmic face protomer. The The NUP358NTD open conformation crystal structure was globally placed by superposition of the ~12 Å cryo‑ET map of the intact human NPC and locally rigid body refined at five positions (left) in the ~7 Å region of an anisotropic composite single particle cryo-EM map of the X. laevis cytoplasmic face protomer (light cyan; EMD-0909) (45). Two orthogonal views (middle and right) of carved out cryo-EM density rendered as transparent isosurfaces are shown superposed to NUP358NTD structures in cartoon representation.
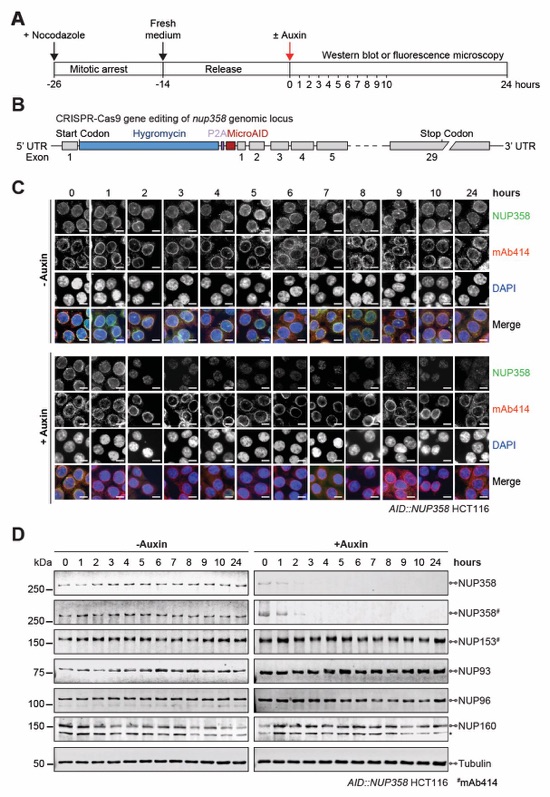
Fig. S60. Validation of auxin-induced NUP358 degradation in AID::NUP358 HCT116 cells. (A) Experimental timeline. (B) Schematic representation of CRISPR/Cas9-mediated genomic tagging of nup358 alleles. (C) Time-resolved subcellular localization analysis of AID-tagged NUP358 by immunofluorescence microscopy upon auxin treatment. The mAb414 antibody (red) and DAPI (blue) staining were used as a reference for the nuclear envelope and nucleus, respectively. Scale bars are 10 μm. (D) Time-resolved western blot analysis of AID-tagged NUP358 expression levels upon auxin treatment. The specificity of auxin induced NUP358 depletion was assessed by the indicated antibodies. Asterisks indicate a nonspecific band detected by the anti-NUP160 antibody. Control cells were not treated with auxin.
Fig. S61. Time-resolved localization analysis of endogenous nups in AID::NUP358 HCT116 cells. (A) Experimental timeline. (B) Time-resolved subcellular localization analysis by immunofluorescence microscopy of endogenous nups in synchronized AID::NUP358 HCT116 cells without auxin treatment, as a control for Fig. 5A. (C) Western blot analysis of nup levels in cytoplasmic and nuclear fractions of synchronized AID::NUP358 HCT116 cells upon auxin‑induced NUP358 depletion, according to the experimental timeline outlined in (A). Control cells were not treated with auxin. A whole cell extract (WC) control is included in the first lane of each blot. Colored regions in the schematics indicate nup locations within the NPC (left). Asterisk indicates a non-specific band. mAb414 antibody recognizes nups containing FG repeats including NUP62, NUP153, NUP214, and NUP358. Scale bars are 10 μm.
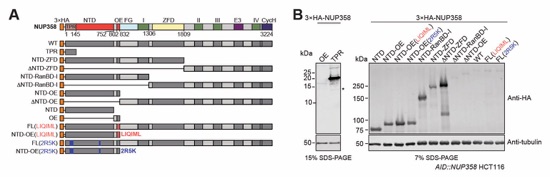
Fig. S62. Expression levels of 3×HA-tagged NUP358 variants in AID::NUP358 HCT116 cells. (A) Schematics indicating the domain boundaries of the transfected N-terminally 3×HA-tagged NUP358 variants. (B) Western blot expression analysis of the 3×HA-NUP358 variants in AID::NUP358 HCT116 cells (corresponding to localization in Fig. 5B).
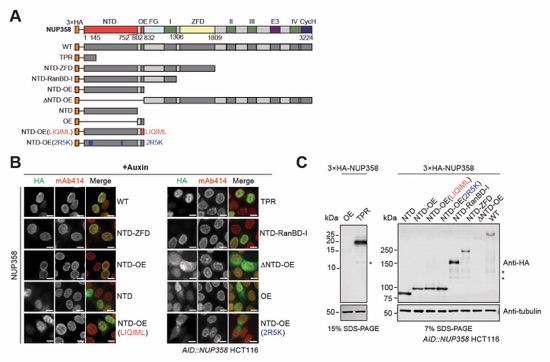
Fig. S63. Localization analysis of 3×HA-tagged NUP358 variants in NUP358 depleted cells. (A) Schematics indicating the domain boundaries of the transfected N-terminally 3×HA-tagged NUP358 variants. (B) Immunofluorescence microscopy localization analysis of 3×HA-NUP358 variants in AID::NUP358 HCT116 cells after 3 hours of auxin treatment. mAb414 antibody staining was used as reference for the nuclear envelope. Scale bars are 10 μm. (C) Western blot expression analysis of 3×HA‑tagged NUP358 variants in AID::NUP358 HCT116 cells after 3 hours of auxin treatment.
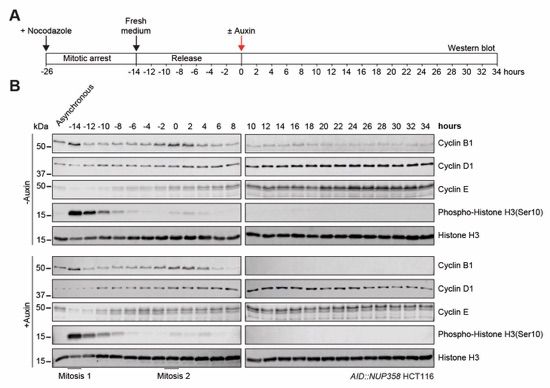
Fig. S64. Analysis of the cell cycle in nocodazole synchronized AID::NUP358 HCT116 cells. (A) Experimental timeline. (B) Time resolved western blot analysis of the indicated cell cycle markers in AID::NUP358 HCT116 cells post release from nocodazole block, establishing an ~14 hour cell cycle. Histone H3 serves as a loading control.
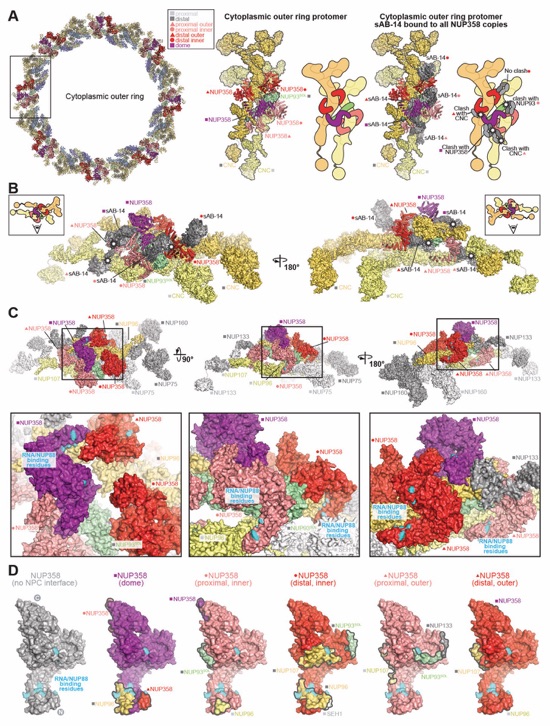
Fig. S65. Accessibility of sAB-14 and RNA/NUP88NTD binding sites in NPC-attached NUP358NTD. (A) Top view of the cytoplasmic face of the human NPC with NUP358NTD docked (left). A closeup view of the region from the inset indicates a single spoke protomer with tandem‑arranged CNCs (distal, gold; proximal, pale yellow), and distal NUP93SOL (pale green) shown in surface representation, as well as five NUP358NTD copies (salmon, red, and purple) shown as cartoons (middle). An equivalent protomer is shown with NUP358NTD•sAB-14 crystal structures superposed to the docked NUP358NTD copies. The sAB-14 heavy chain (light gray) and light chain (dark gray) are shown in surface representation. White stars indicate potential clashes that would occur if sAB-14 bound to a given NPC-attached NUP358NTD. Schematics are shown to facilitate the interpretation of the rendered cartoons and surfaces. Distal and proximal positions are labeled according to the legend. (B) Two side views orthogonal to the cytoplasmic face protomer superposed with NUP358NTD•sAB-14 in (A). (C) Three views of a surface representation of the cytoplasmic face protomer with closeup views of the regions in the insets. Residues identified as involved in RNA and NUP88NTD binding by surface mutagenesis of NUP358NTD are colored cyan. (D) Surface representation (gray) of NUP358NTD with RNA/NUP88NTD-binding residues colored cyan (left). Five NUP358NTD copies found at the five unique positions in the cytoplasmic face protomer and colored accordingly (salmon, red, and purple) are shown in the same orientation, with RNA/NUP88NTD-binding residues colored cyan, and surface patches colored according to the color assigned to the interfacing nup.
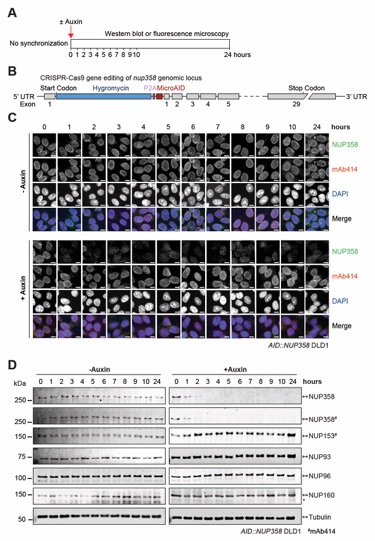
Fig. S66. Validation of auxin-induced NUP358 degradation in AID::NUP358 DLD1 cells. (A) Experimental timeline. (B) Schematic representation of CRISPR/Cas9-mediated genomic tagging of nup358 alleles. (C) Time-resolved subcellular localization analysis of AID-tagged NUP358 by immunofluorescence microscopy upon auxin treatment. The mAb414 antibody (red) and DAPI (blue) staining were used as a reference for the nuclear envelope and nucleus, respectively. Scale bars are 10 μm. (D) Time-resolved western blot analysis of AID-tagged NUP358 expression levels upon auxin treatment. The specificity of auxin induced NUP358 depletion was assessed by the indicated antibodies. Asterisks indicate a nonspecific band detected by the anti-NUP160 antibody. Control cells were not treated with auxin.
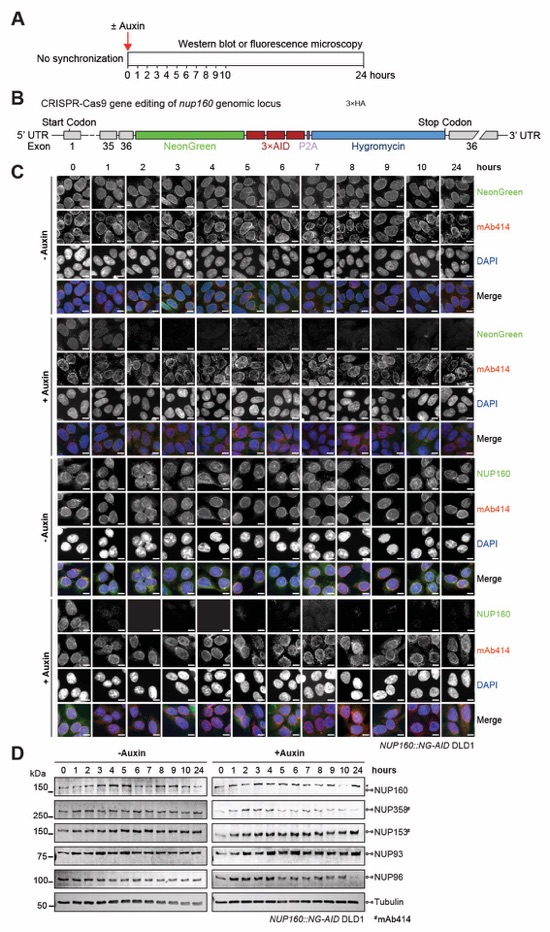
Fig. S67. Validation of auxin-induced NUP160 degradation in NUP160::NG-AID DLD1 cells. (A) Experimental timeline. (B) Schematic representation of CRISPR/Cas9-mediated genomic tagging of nup160 alleles. (C) Time-resolved subcellular localization analysis of NeonGreen (NG)‑AID-tagged NUP160 by immunofluorescence microscopy upon auxin treatment. The NG‑AID‑tagged NUP160 was detected by an anti-NUP160 antibody (green) or NeonGreen fluorescence (green). The mAb414 antibody (red) and DAPI (blue) staining were used as a reference for the nuclear envelope and nucleus, respectively. Scale bars are 10 μm. (D) Time‑resolved western blot analysis of NG-AID-tagged NUP160 expression levels upon auxin treatment. The specificity of auxin induced NUP160 depletion was assessed by the indicated antibodies. Asterisks indicate a nonspecific band detected by the anti-NUP160 antibody. Control cells were not treated with auxin.
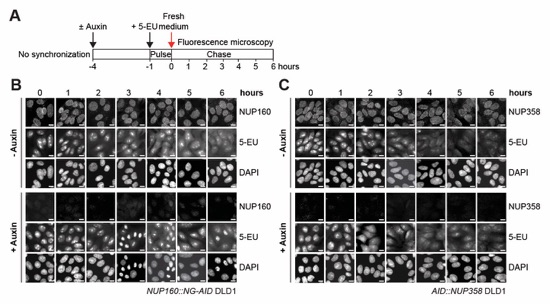
Fig. S68. Time‑resolved analysis of nuclear RNA retention in NUP160/NUP358 depleted DLD1 cells. (A) Experimental timeline. (B, C) Time‑resolved fluorescence microscopy analysis of RNA nuclear retention in (B) NUP160::NG‑AID or (C) AID::NUP358 DLD1 cells upon auxin treatment. Nascent RNA was metabolically pulse‑labeled with 5-ethynyl uridine (5-EU) and its subcellular localization determined by Alexa Fluor 594 azide conjugation and fluorescence microscopy at the indicated time points. Scale bars are 10 μm.
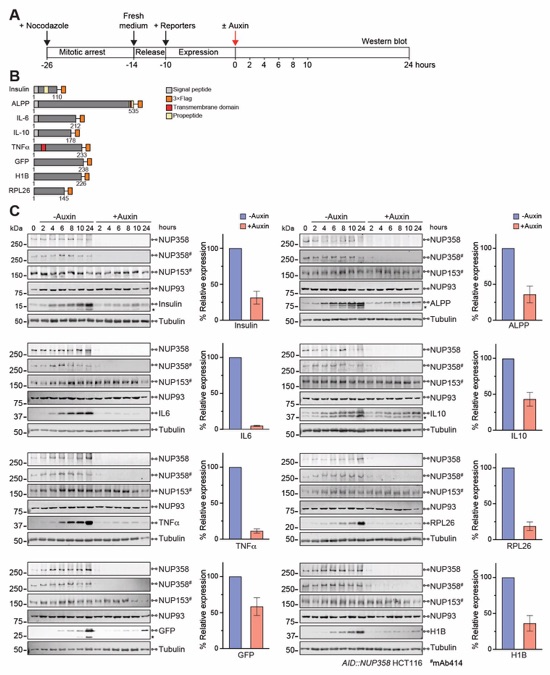
Fig. S69. Depletion of NUP358 reduces reporter protein expression. (A) Experimental timeline. (B) Domain structures of the transfected C-terminally 3×FLAG-tagged reporters. (C) Time-resolved western blot expression analysis of the 3×FLAG-tagged reporter proteins in synchronized AID::NUP358 HCT116 cells upon auxin-induced NUP358 depletion. Control cells were not treated with auxin. Quantitated reporter expression in auxin-treated cells was normalized to expression in control cells, at the 10‑hour timepoint. Experiments were performed in triplicate, and the mean with the associated standard error reported. Asterisks indicate degradation bands detected by the anti‑FLAG antibody.
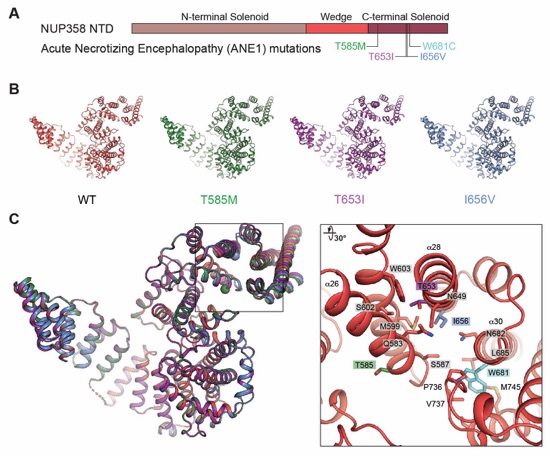
Fig. S70. Structural analysis of NUP358NTD containing ANE1 mutations (A) NUP358NTD domain architecture with location of ANE1 mutations indicated. (B) Structures of wildtype NUP358NTD and three distinct ANE1 mutants (T585M, T653I, or I656V) shown individually and (C) superposed in cartoon representation. A magnified view of the inset region shows the local environment of the four ANE1‑associated mutation sites (right).
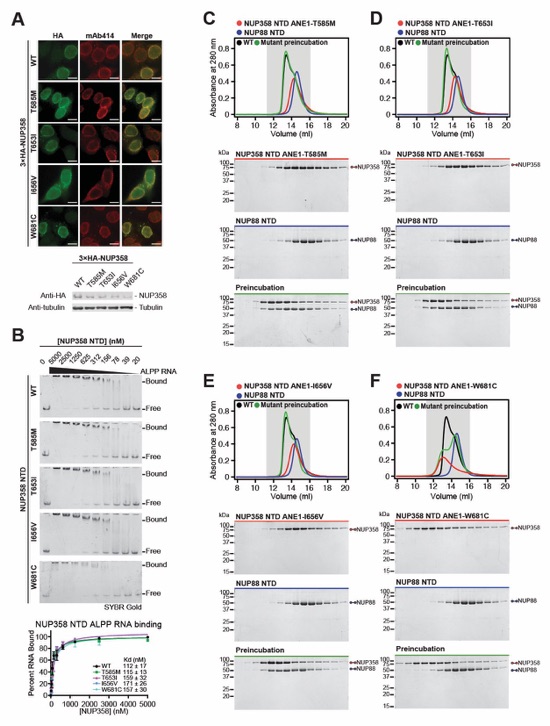
Fig. S71. Characterization of NUP358 ANE1 mutants localization and interaction analysis with NUP88NTD and ALPPSSCR RNA. (A) Subcellular localization analysis by immunofluorescence microscopy of N-terminally 3×HA-tagged NUP358 ANE1 mutants in AID::NUP358 HCT116 cells. The mAb414 antibody (red) staining was used as a reference for the nuclear envelope. Scale bars are 10 μm. Expression of NUP358 mutants was verified by western blot of whole cell extracts. (B) EMSA titrations of NUP358NTD variants against ALPPSSCR RNA visualized with SYBR Gold stain. Representative titrations of triplicate are shown. Triplicate EMSA experiments are plotted with mean values and standard errors. Apparent dissociation constants (KD) were estimated by fitting single-site binding models to the data. (C‑F) SEC interaction analysis of NUP88NTD with (C) NUP358NTD T585M, (D) NUP358NTD T653I, (E) NUP358NTD I656V, (F) and NUP358NTD W681C. SEC profiles of NUP358NTD variants (red) and NUP88NTD (blue) are shown individually and after their preincubation (green). Preincubation with wildtype NUP358NTD shown in black for reference. SEC profiles were obtained using a Superdex 200 10/300 GL column. Gray boxes indicate fractions resolved on SDS‑PAGE gels and visualized by Coomassie brilliant blue staining.
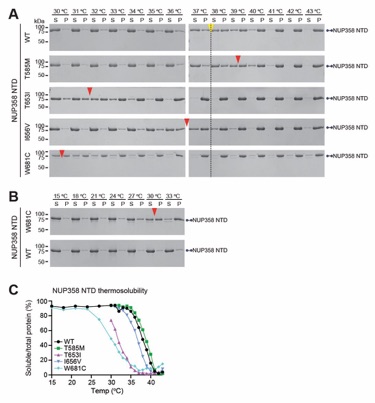
Fig. S72. Thermosolubility assay of NUP358 harboring ANE1 mutants. (A) Wildtype and NUP358NTD mutants associated with ANE1 (T585M, T653I, I656V, and W681C) were incubated for 20 minutes at the indicated temperatures prior to centrifugation. Pelleted (P) and soluble (S) fractions were analyzed by SDS-PAGE and visualized by Coomassie brilliant blue staining. (B) Lower temperature range thermosolubility pelleting assay for highly unstable NUP358NTD W681C and wildtype Nup358NTD. Red arrows indicate 50% solubility temperature for NUP358NTD ANE1 mutants. For reference, a yellow arrow indicates 50% solubility temperature of wildtype NUP358NTD. (C) Quantitation of thermosolubility pelleting assay of wildtype and ANE1 mutant purified NUP358NTD, ratio of soluble over total protein is plotted for each temperature.
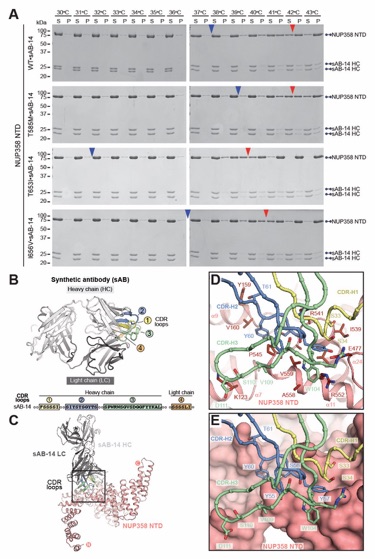
Fig. S73. Thermosolubility of NUP358NTD ANE1 mutations is increased by sAB-14 binding. (A) Thermosolubility assay of NUP358 harboring ANE1 mutants (T585M, T653I, I656V) in the presence of sAB-14. Wildtype NUP358NTD and mutants associated with ANE1 were pre-complexed with sAB-14 and purified by SEC prior to performing the protein thermosolubility pelleting assay. Complexes were incubated at the indicated temperatures for 20 minutes prior to centrifugation. Pelleted (P) and soluble (S) fractions were analyzed by SDS-PAGE and visualized by Coomassie brilliant blue staining. The 50% solubility temperature for proteins in isolation and in presence of sAB‑14 are indicated by blue and red arrows, respectively. (B) sAB-14 structure shown in cartoon representation. The sequences of the four complementarity determining region (CDR) loops are provided and their location in the structure indicated. (C) Structure of NUP358NTD•sAB-14 shown in carton representation. The sAB-14 binding site is located on the convex surface of NUP358NTD at the interface between the N-terminal solenoid and central wedge domain. The inset indicates the region magnified in panels (D) and (E). (D) Magnified view of the sAB-14-NUP358NTD interface, illustrating the tight interactions formed by the four sAB-14 CDR loops with an exposed hydrophobic patch on the NUP358NTD surface. (E) Magnified view as (D) with NUP358NTD shown in surface representation highlighting the shape complementarity of the sAB-14 CDR loops.
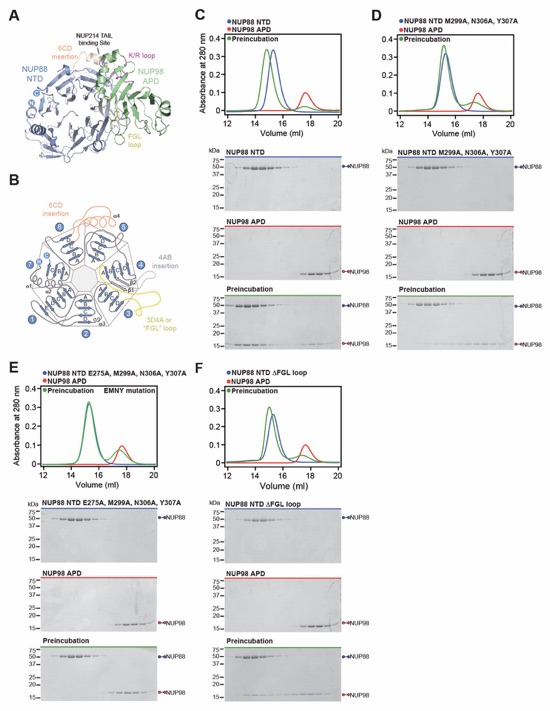
Fig. S74. Mutational analysis of the NUP88NTD-Nup98APD interaction. (A) Cartoon representation of the NUP88NTD•NUP98APD crystal structure. (B) Schematic of the seven-bladed NUP88NTD β‑propeller domain, indicating prominent loop insertions. (C-F) SEC interaction analyses of NUP98APD with (C) wildtype NUP88NTD, (D) the NUP88NTD M2999A/N306A/Y307A mutant, (E) the NUP88NTD E275A/M2999A/N306A/Y307A mutant, and (F) the NUP88NTD ΔFGL‑loop mutant. SEC profiles of wildtype and mutant NUP88NTD (blue) and NUP98APD (red) are shown individually and after their preincubation (green). SEC profiles were obtained using a Superdex 200 10/300 GL column. Gray boxes indicate fractions resolved on SDS‑PAGE gels and visualized by Coomassie brilliant blue staining.
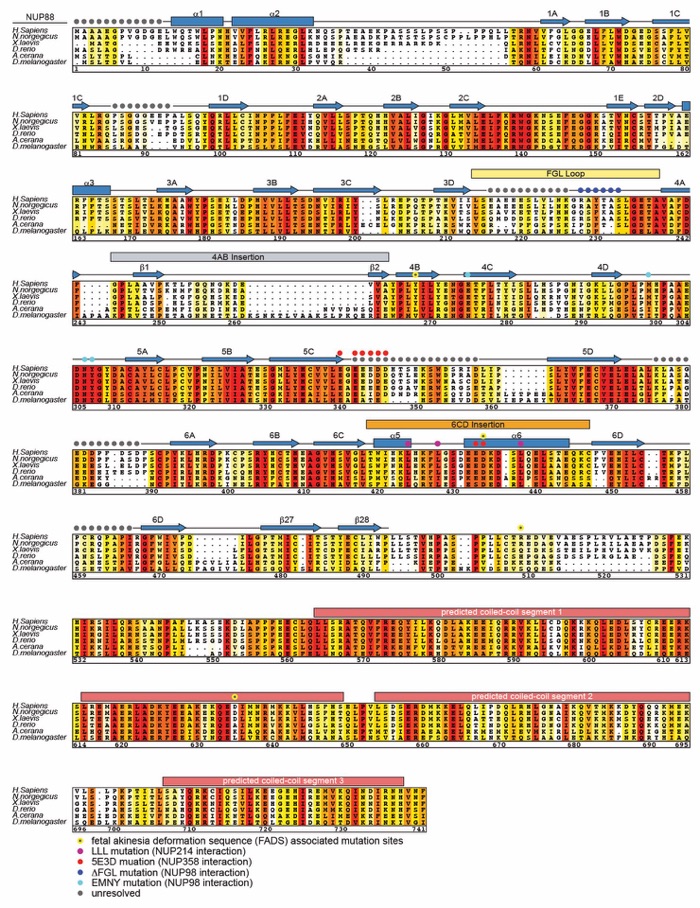
Fig. S75. Multispecies sequence alignment of NUP88. Sequences of NUP88 from six species were aligned and colored according to similarity using the BLOSUM62 matrix from white (less than 40% similarity), through yellow (60% similarity), to red (100% identity). The numbering is according to the H. sapiens protein. For NUP88NTD, the secondary structure is indicated above the sequences as rectangles (α‑helices), arrows (β-strands), and lines (unstructured regions). Unresolved residues are indicated by gray dots. For NUP88CTD, the secondary structure elements were predicted by JPred4 (146). Residues of sequence variations associated with fetal akinesia deformation sequence disease (93) are indicated by yellow dots. Residues substituted by alanine in the NUP88NTD 5E3D, LLL, and EMNY combination mutants are indicated by red, magenta, and cyan dots, respectively. Residues removed in the ΔFGL loop mutation are indicated by blue dots.
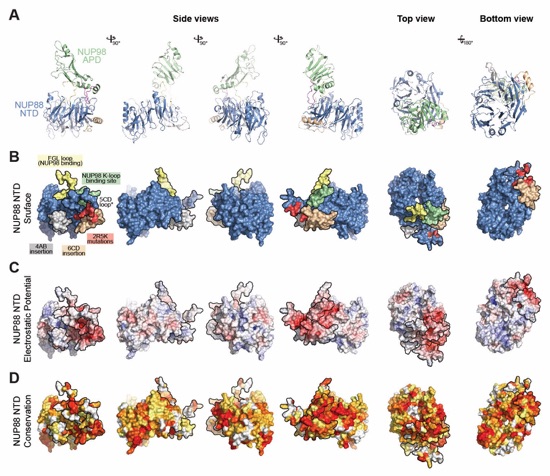
Fig. S76. Surface properties of NUP88NTD. (A) Cartoon representation of the NUP88NTD•NUP98APD crystal structure. (B) Surface representation of NUP88NTD colored as in (A). The binding site of NUP98 (green) and the approximate location of the residues of the 2R5K combination mutant (yellow), which are located in the unresolved 5CD loop and abolish NUP358NTD binding, are indicated. (C) Surface representation colored according to electrostatic potential from red (-10 kBT/e) to blue (+10 kBT/e). (D) Surface representation colored according to sequence identity based on the alignment in fig. S75.The NUP98APD binding site is strongly negatively charged.
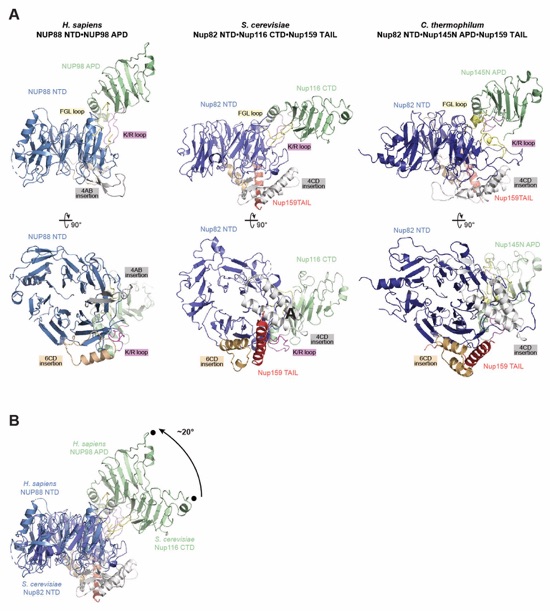
Fig. S77. Evolutionary conservation of the NUP88NTD•NUP98APD•NUP214TAIL architecture. (A) Cartoon representations of the NUP88NTD•NUP98APD co-crystal structure and the previously determined crystal structures of S. cerevisiae Nup82NTD•Nup116CTD•Nup159TAIL (PDB ID 3PBP) (59) and C. thermophilum Nup82NTD•Nup145NAPD•Nup159TAIL (PDB ID 5CWW) (11), illustrating the evolutionary conservation of the NUP88/Nup82 FGL, 6CD, and 4AB/4CD loops and the NUP98/Nup116/Nup145N K/R loop (top). 90º-rotated views of all three complexes illustrating the location of the NUP88/Nup82NTD 6CD, and 4AB/4CD loop insertions that form the evolutionarily conserved binding site for NUP214/Nup159TAIL (bottom). (D) Superposition of H. sapiens and S. cerevisiae structures indicating the ~20° rotation of NUP98APD/Nup116CTD.
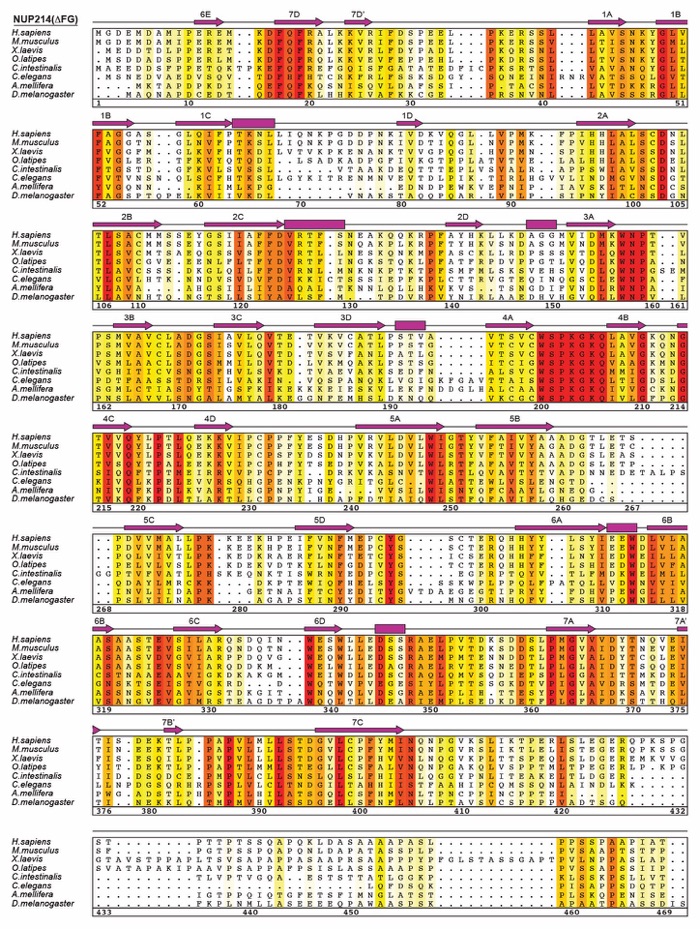
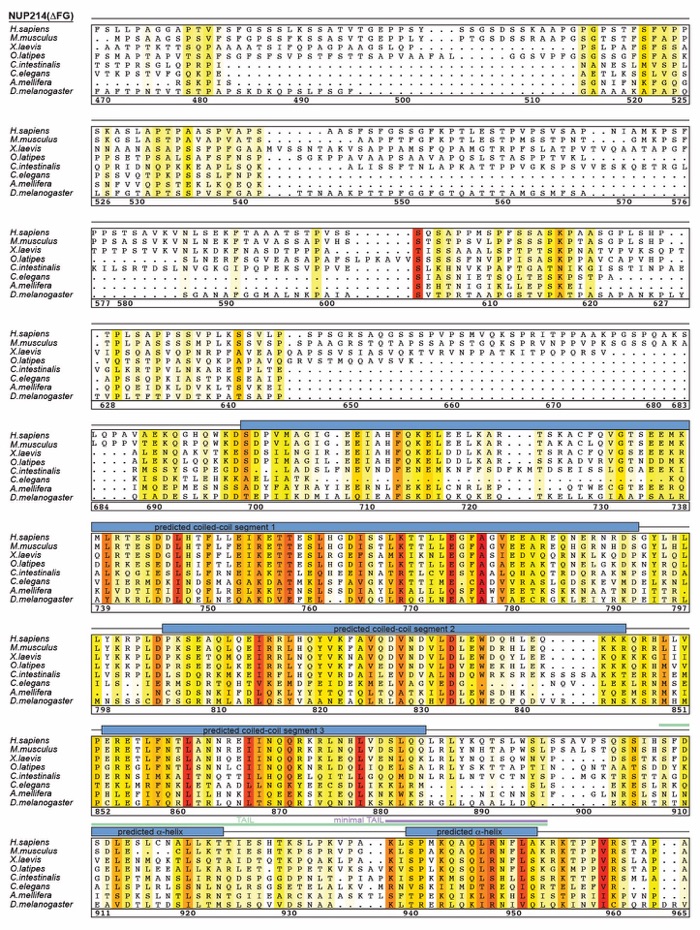
Fig. S78. Multispecies sequence alignment of NUP214. Sequences of NUP214 from eight species were aligned and colored according to similarity using the BLOSUM62 matrix from white (less than 40% similarity), through yellow (60% similarity), to red (100% identity). The numbering is according to the H. sapiens protein. For NUP214NTD, the secondary structure is indicated above the sequences as rectangles (α‑helices, magenta), arrows (β-strands, magenta), and lines (unstructured regions, gray) and was derived from the previously reported crystal structure (PDB ID 2OIT) (54). The secondary structure elements of the structurally uncharacterized C‑terminal coiled-coil region is indicated as rectangles (α‑helices, blue) and was determined with JPred4 (146). The C-terminal ~1,100-residue FG-repeat region was omitted.
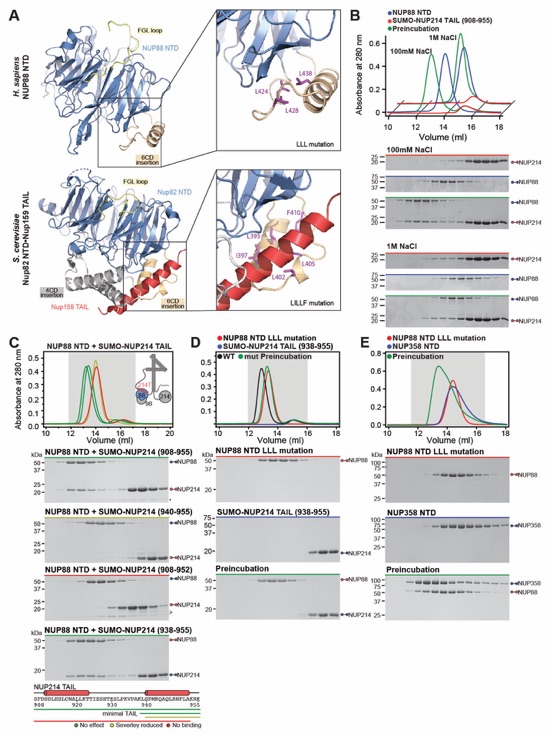
Fig. S79. Evolutionary conservation of NUP214 TAIL binding site on NUP88NTD. (A) Cartoon representation of H. sapiens NUP88NTD•NUP98APD and S. cerevisiae Nup82NTD•Nup159TAIL•Nup116CTD (PDB ID 3PBP) (59), colored according to Fig. 6H. The insets indicate the location of the Nup82NTD•Nup159TAIL interface and the corresponding region in NUP88NTD that are magnified on the right. The five scNup82NTD residues of the previously identified LILLF (L393A, I397A, L402A, L405A, and F410A) combination mutant, located in the 6CD loop (59), and the corresponding three residues (L424, L428, and L438) of NUP88NTD are shown in ball-and-stick representation (purple). For clarity, NUP98APD Nup116CTD have been omitted. (B) SEC interaction analysis of NUP88NTD with SUMO-tagged NUP214TAIL in buffers containing 100 mM or 1 M NaCl, establishing the salt-stable nature of the interaction. (C) SEC interaction analysis of NUP88NTD with the indicated SUMO-tagged NUP214TAIL truncations, identifying a minimal NUP214TAIL fragment (minimal TAIL; residues 938-955), which is sufficient for NUP88NTD binding. Summary of truncation mapping of minimal NUP214TAIL fragment binding NUP88NTD (bottom). (D) SEC interaction analyses of SUMO-tagged NUP214minimal TAIL with wildtype NUP88NTD and the NUP88NTD LLL (L424A, L428A, and L438A) combination mutant. The NUP88NTD LLL mutation abolishes the NUP214minimal TAIL interaction, identifying the NUP214minimal TAIL binding site on the NUP88NTD surface and suggesting a binding mode that is evolutionarily conserved from yeast to human. (E) SEC interaction analysis of the NUP88NTD LLL combination mutant with NUP358NTD, demonstrating that the NUP88NTD LLL mutation does not affect the NUP358NTD interaction. SEC profiles were obtained using a Superdex 200 10/300 GL column. Gray boxes indicate fractions resolved on SDS‑PAGE gels and visualized by Coomassie brilliant blue staining.
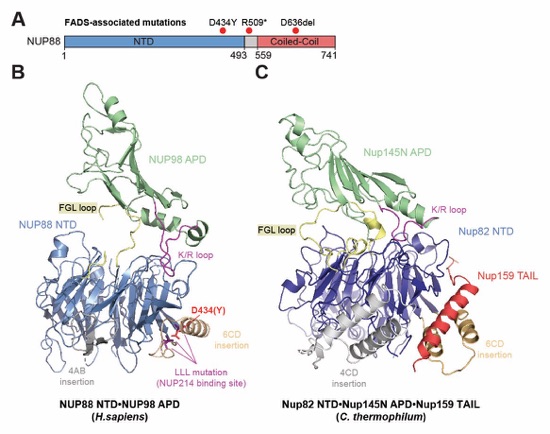
Fig. S80. FADS-associated NUP88 D434Y mutation is located at the NUP214TAIL binding site. (A) NUP88 domain architecture indicating locations of the three mutations associated with fetal akinesia deformation sequence (FADS) (93). The D434Y mutant is located in the 6CD loop insertion of NUP88NTD, directly adjacent to the identified NUP214TAIL binding site (L424, L428, and L438). The nonsense mutation R509* truncates the C-terminal coiled‑coil domain, whereas the single residue deletion of D636 falls within the predicted coiled‑coil domain. (B) Co-crystal structure of NUP88NTD•NUP98APD is shown in cartoon representation and colored according to Fig 9, indicating the location of D434 and the adjacent L424, L428 and L438 of the LLL mutation of NUP88NTD. (C) Crystal structure of C. thermophilum Nup82NTD•Nup145NAPD• Nup159TAIL (PDB ID 5CWW) (11) shown in cartoon representation, illustrating the involvement of the 6CD loop of Nup159NTD in anchoring Nup159TAIL.
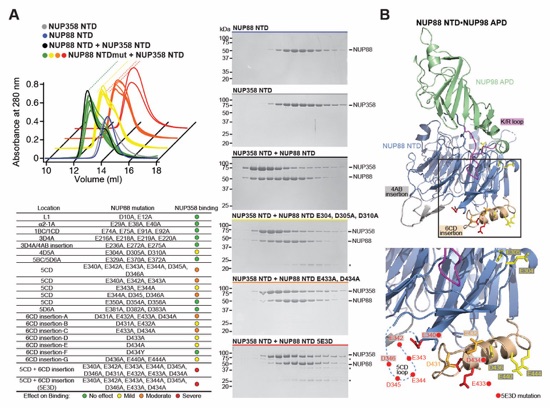
Fig. S81. Identification of the NUP88NTD 5E3D mutation interrupting NUP358NTD binding. (A) SEC interaction analyses of the indicated NUP88NTD mutants with NUP358NTD. Stacked preincubation curves are shown grouped by effect category; no effect (green, front), mild effect (yellow), moderate effect (orange), and severe effect (red) on NUP358NTD binding. SDS-PAGE gels of representative preincubation peak fractions are shown. (B) Structure of NUP88NTD•NUP98APD shown in cartoon representation. Residues that affect NUP358NTD binding are shown in ball-and-stick representation. The inset marks the location of the mutation that affects NUP358NTD binding. A dashed line indicates the approximate location of the unresolved acidic 5CD loop. Red circles indicate alanine substitutions in the 5E3D mutant.
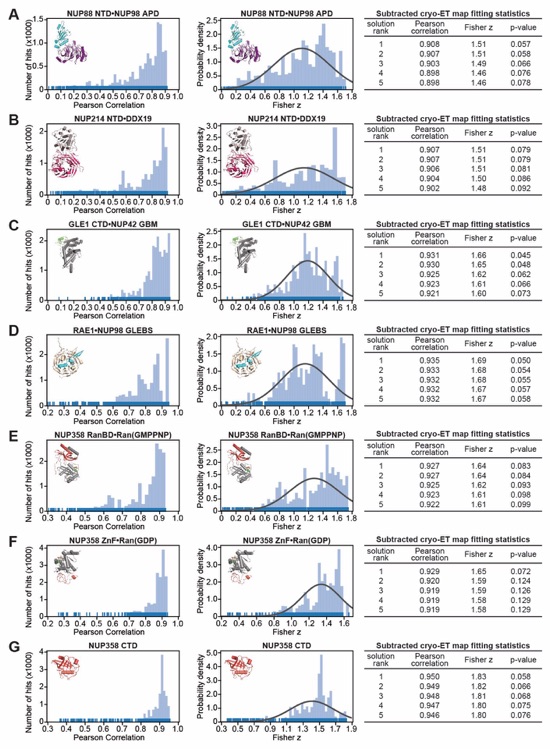
Fig. S82. Quantitative docking searches for CF subunits. Resolution-matched densities simulated from the crystal structures of (A) NUP88NTD•NUP98APD, (B) NUP214NTD•DDX19 (PDB ID 3FMO) (55), (C) GLE1CTD•NUP42GBM (PDB ID 6B4F) (63), (D) RAE1•NUP98GLEBS (PDB ID 3MMY) (57), (E) NUP358RanBD‑II•Ran, (F) NUP358ZnF3•Ran, and (G) NUP358CTD (PDB ID 4I9Y) (129) were quantitatively docked into the ~12 Å sub-tomogram averaged cryo-ET map of the intact human NPC (EMD-14322) (46) from which cryo-ET density corresponding to all placed nucleoporins was subtracted. Rug plots (blue) and histograms (light blue) of Pearson correlation scores (left) and derived Fisher z scores fit with a normalized Gaussian curve (black) from a global search with 1 million random initial placements (middle) are shown. A tabular summary of the solutions fitting statistics, along with one-tailed p-values calculated from the Fisher z score distribution, is shown (right). No docking solution segregated to high confidence.
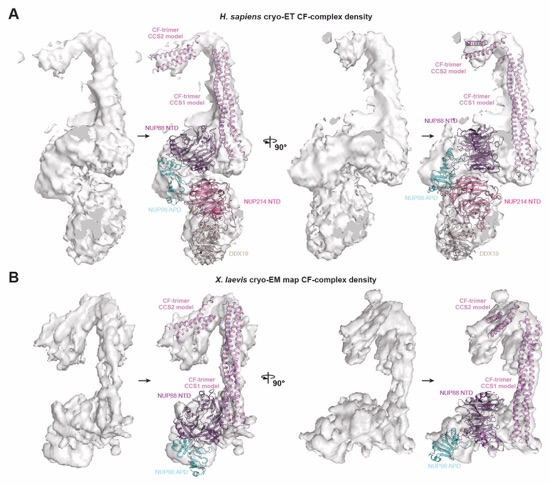
Fig. S83. Docking and modeling of the H. sapiens and X. laevis CFNC complex. The CFNC complex was modeled by manually docking and rigid body refining structures against (A) the ~12 Å cryo-ET map of the intact human NPC (EMD-14322) (46) and (B) a ~8 Å region of the anisotropic composite single particle cryo-EM map of the X. laevis cytoplasmic outer ring protomer (EMD-0909) (45). In lieu of an experimental structure of the CFNC-hub coiled‑coils, poly-alanine models of the CFNC-hub coiled‑coil segments CCS1 and CCS2 (pink) were derived from the X. laevis NUP54•NUP58•NUP62 (PDB ID 5C3L) (10) and C. thermophilum Nup49•Nup57•Nsp1 (PDB ID 5CWS) (11) complexes and fit into the tube-like densities. NUP88NTD•NUP98APD (purple and cyan) was placed in a disk-like density at the base of the long CFNC-hubCCS1 structure. The dumbbell-shaped density assigned to NUP214NTD•DDX19 (bright pink and umber) in the human ~12 Å cryo-ET map was not present in the ~8 Å region of the anisotropic composite single particle cryo-EM map of the X. laevis cytoplasmic outer ring protomer. Cryo-EM and cryo-ET densities were carved out from larger maps for illustrative purposes and rendered as gray isosurface. Structures and models are shown as cartoons.
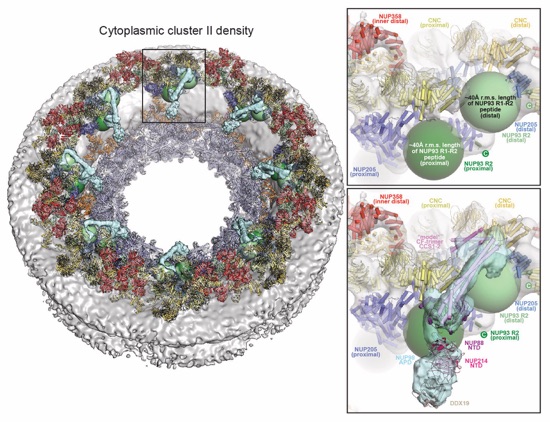
Fig. S84. NUP93R1-R2 peptide can span the distance between NUP205 and the CFNC-hub binding sites. Composite structure of the human NPC shown as cartoon. The nuclear envelope (gray) and unassigned density cluster II, corresponding to the CFNC (cyan), are shown as isosurfaces (left). Root mean square (r.m.s.) end-to-end length estimates for the NUP93R1-R2 peptide that links the NUP93R2 region that binds to NUP205 and the NUP93R1 region that binds to the CFNC-hub, are shown as spheres (proximal, green; distal, pale green). Magnified view of the region in the inset box shown in the absence (right top) and presence (right bottom) of the unassigned density cluster II and the CFNC-hub model docked in it. The distal NUP93R1 region is expected in the vicinity of CFNC-hub coiled‑coil segments CCS1, CCS2, and likely of the unresolved CCS3.
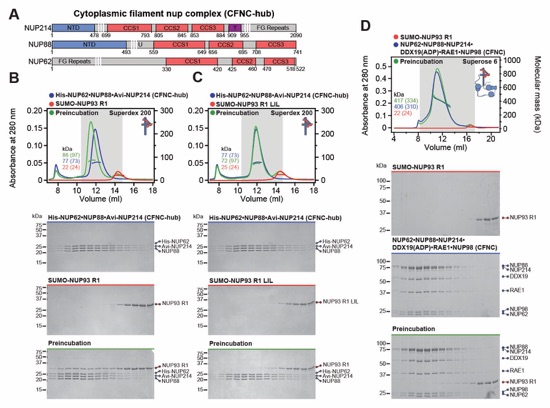
Fig. S85. NUP93 anchors the human CFNC to the NPC. (A) Domain architectures of NUP214, NUP88, and NUP62 showing the predicted coiled‑coil segments, CCS1, CCS2, and CSCS3, which form the CFNC-hub. (B) SEC-MALS interaction analysis of the human CFNC-hub with SUMO-NUP93R1, demonstrating the formation of a stable stochiometric complex. (C) SEC-MALS interaction analyses of the human CFNC-hub with the NUP93R1 LIL combination mutant, which we identify in the accompanying manuscript to abolish the interaction with the NUP54•NUP58•NUP62 channel nup hetero-trimer (CNT) (42), showing that the NUP93R1 LIL mutant also abolishes the interaction with the human CFNC-hub. To resolve the three stoichiometric protein bands of the human CFNC-hub by SDS-PAGE, NUP62CCS1-3 and NUP214CCS1-3 were tagged with His6-PreScission- and Avi-tag sequence overhangs, respectively. SEC interactions with the untagged proteins yielded identical results. (D) SEC-MALS interaction analysis of NUP93R1 with human hetero-hexameric CFNC. SEC-MALS profiles of nups and nup complexes are shown individually (blue and red) and after their preincubation (green). SEC profiles were obtained using a Superdex 200 10/300 GL or a Superose 6 10/300 GL column, as indicated. Measured molecular masses are indicated, with the respective theoretical masses shown in parentheses. Inset schematics display tested protein samples colored to match the corresponding chromatogram trace. Gray boxes indicate fractions resolved on SDS‑PAGE gels and visualized by Coomassie brilliant blue staining.
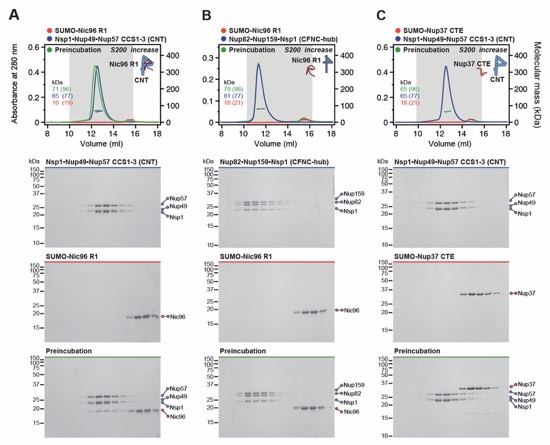
Fig. S86. Nic96 and Nup37 assembly sensors possess binding specificity for CNT and CFNC-hub. SEC-MALS interaction analyses of (A) SUMO-Nic96R1 with CNT, (B) SUMO-Nic96R1 with CFNC-hub, and (C) SUMO-Nup37CTE with CNT. Whereas Nup37CTE exclusively binds the CFNC-hub, Nic96R1 exclusively binds to the CNT, and not vice versa. SEC profiles of nups or nup complexes are shown individually (blue and red) and after their preincubation (green). SEC profiles were obtained using a Superdex 200 Increase 10/300 GL column. Measured molecular masses are indicated, with the respective theoretical masses shown in parentheses. Inset schematics display tested protein samples shaded to match corresponding chromatogram trace. Gray boxes indicate fractions resolved on SDS‑PAGE gels and visualized by Coomassie brilliant blue staining.
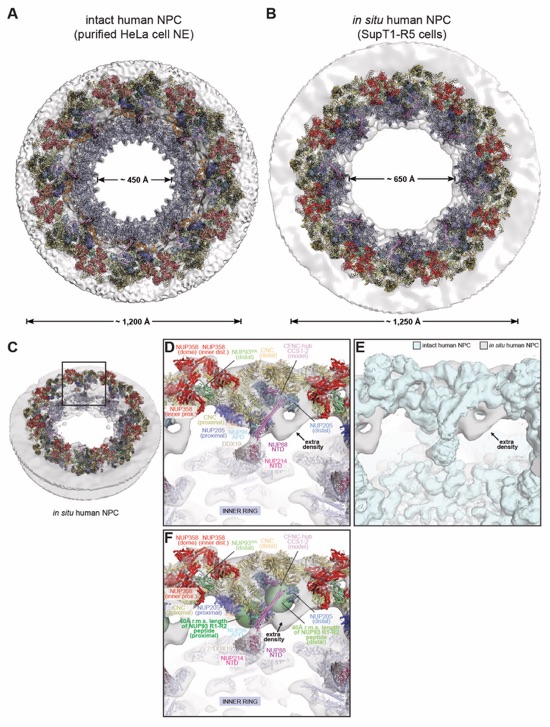
Fig. S87. Additional density in unassigned density cluster II from dilated in situ human NPC. (A, B) Comparison of the cytoplasmic face of (A) the constricted human NPC imaged in purified HeLa cell nuclear envelopes and (B) the dilated human NPC imaged in situ in SupT1-R5 cells. Outer and inner ring spoke subcomplexes from the composite NPC structure built into the constricted ~12 Å cryo-ET sub‑tomogram averaged human NPC map (EMD-14322) (46) were manually docked and locally fit as rigid units in the dilated in situ ~37 Å cryo-ET sub-tomogram averaged human NPC map (EMD-11967) (95). The composite NPC structures are shown as cartoons and superposed to isosurfaces of the constricted and dilated NPCs (gray). (C) A 60º‑rotated overview of the dilated human NPC. The inset box indicates the region magnified in the following panels. (D) Magnified view of the docked structures and model of the CFNC-hub (lacking CCS3) are shown as cartoons superposed to the cryo-ET map of the dilated human NPC rendered as gray isosurface. (E) Magnified view of the cryo-ET map of the dilated human NPC (gray), superposed to the cryo-ET map of the constricted human NPC (cyan). Whereas the density of the constricted human NPC is entirely explained by the composite structure, additional unexplained density adjacent to the assigned CFNC-hub is observed in the map of the dilated human NPC (black arrow). (F) Magnified view as in panel (D) with green spheres indicating the root mean square (r.m.s) end-to-end length estimates for the NUP93R1-R2 peptide connector, which links NUP93R2•NUP205 with the NUP93R1•CFNC-hub (proximal, green; distal, pale green). The unassigned rod-shaped density of the cryo-ET map of the dilated human NPC is in close proximity to NUP205•NUP93R2, suggesting that the unexplained additional density may accommodate a second CFNC copy. The composite structures in all figure panels are colored according to Fig. 6.
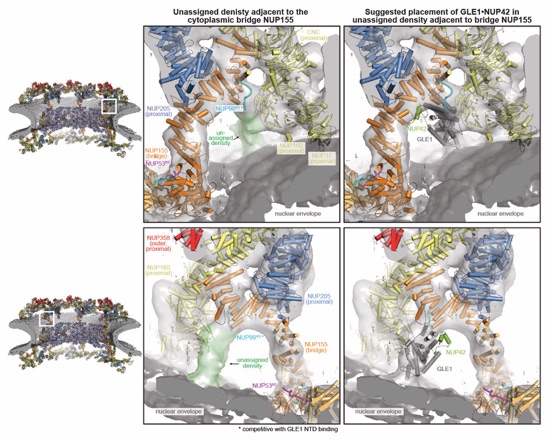
Fig. S88. Suggested placement of GLE1CTD•NUP42. Overview of the composite structure of the human NPC (left). The inset boxes indicate regions magnified in the middle and right panels, harboring unassigned cytoplasmic density directly adjacent to the bridging NUP155 molecules in the ~12 Å cryo‑ET map of the intact human NPC (EMD-14322) (46). Magnified views illustrating the globular shape and environment of the cytoplasmic unexplained density (green) shown from the front and the back (middle). As previously proposed (63), the manually placed GLE1CTD•NUP42 structure (PDB ID 6B4F) accounts for the unexplained density and is consistent with previous biochemical analyses showing that GLE1NTD and NUP98R3 bind to NUP155 in a mutually exclusive fashion (right). GLE1CTD•NUP42 is shown in cartoon representation and colored in dark gray and green. The quantitatively docked nups in close proximity to the unassigned density are shown in cartoon representation and colored according to Fig. 6. Cryo‑ET densities corresponding to protein and nuclear envelope are rendered as gray and dark gray isosurfaces, respectively.
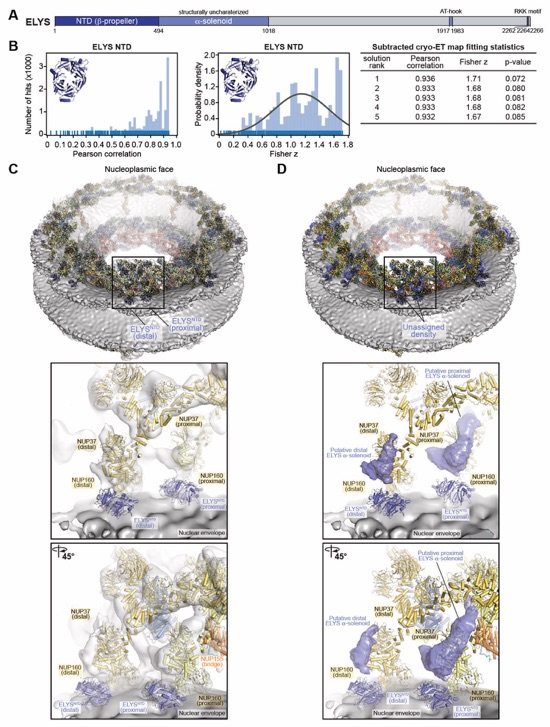
Fig. S89. ELYS placement on nuclear face of the NPC. (A) Domain architecture of human ELYS with residue numbers indicated. The AT-hook and RRK motifs interact with chromatin (147, 148). (B) Resolution-matched densities simulated from the M. musculus ELYSNTD crystal structure (PDB ID 4I0O) (25) were quantitatively docked into the ~12 Å sub-tomogram averaged cryo-ET map of the intact human NPC (EMD-14322) (46) from which cryo-ET density corresponding to all placed nups was subtracted. Rug plots (blue) and histograms (light blue) of Pearson correlation scores (left) and derived Fisher z scores fit with a normalized Gaussian curve (black) from a global search with 1 million random initial placements are shown (middle). A tabular summary of the solutions fitting statistics, along with one-tailed p-values calculated from the Fisher z score distribution (right). No docking solution segregated to high confidence. (C) Two magnified views (middle and bottom) of the region in the inset box (top), showing the placement of ELYSNTD copies into disk-shaped density adjacent to nuclear proximal and distal NUP160 copies and the nuclear envelope. Docked structures are shown in cartoon representation. Cryo‑ET densities corresponding to protein and nuclear envelope are rendered as gray and dark gray isosurfaces, respectively. (D) Views as in (C), with unexplained crescent-shaped densities suggested to correspond to the ELYS α-solenoid domain rendered as isosurface (dark blue).
Docked Structures (Pymol Session), warning: very large files:
7TBL (12 Å constricted human NPC), 7TBM (37 Å dilated human NPC)
Docked Structures (Chimera Session), warning: very large files:
7TBL (12 Å constricted human NPC), 7TBM (37 Å dilated human NPC)
Composite spoke protomer (.cif):
7TBL (12 Å constricted human NPC), 7TBM (37 Å dilated human NPC)
Composite spoke protomer rotation matrices (.txt):
7TBL (12 Å constricted human NPC), 7TBM (37 Å dilated human NPC)
PDB coordinates (link to PDB site):
7MNJ (NUP358145‑673), 7MNK (NUP358OE), 7MNI (NUP88NTD•NUP98APD), 7MNL (NUP358NTD•sAB‑14), 7MNM (NUP358NTD T585M•sAB‑14), 7MNN (NUP358NTD T653I•sAB‑14), 7MNO (NUP358NTD I656V•sAB‑14), 7MNP (NUP358ZnF2•Ran(GDP)), 7MNQ (NUP358ZnF2•Ran(GDP)), 7MNR (NUP358ZnF3•Ran(GDP)), 7MNS (NUP358ZnF4•Ran(GDP)), 7MNT (NUP358ZnF5/6•Ran(GDP)), 7MNU (NUP358ZnF7•Ran(GDP)), 7MNV (NUP358ZnF8•Ran(GDP)), 7MNW (NUP358RanBD-I•Ran(GMPPNP)), 7MNX (Nup358RanBD‑II•Ran(GMPPNP)), 7MNY (NUP358RanBD-III•Ran(GMPPNP)), 7MNZ (NUP358RanBD‑IV•Ran(GMPPNP)), 7MO0 (NUP50RanBD•Ran(GMPPNP)), 7MO1 (NUP153ZnF1•Ran(GDP)), 7MO2 (NUP153ZnF2•Ran(GDP)), 7MO3 (NUP153ZnF3•Ran(GDP), 2.05Å), 7MO4 (NUP153ZnF3•Ran(GDP), 2.4Å), 7MO5 (NUP153ZnF4•Ran(GDP)).
PDB coordinates (.pdb):
7MNJ (NUP358145‑673), 7MNK (NUP358OE), 7MNI (NUP88NTD•NUP98APD), 7MNL (NUP358NTD•sAB‑14), 7MNM (NUP358NTD T585M•sAB‑14), 7MNN (NUP358NTD T653I•sAB‑14), 7MNO (NUP358NTD I656V•sAB‑14), 7MNP (NUP358ZnF2•Ran(GDP)), 7MNQ (NUP358ZnF2•Ran(GDP)), 7MNR (NUP358ZnF3•Ran(GDP)), 7MNS (NUP358ZnF4•Ran(GDP)), 7MNT (NUP358ZnF5/6•Ran(GDP)), 7MNU (NUP358ZnF7•Ran(GDP)), 7MNV (NUP358ZnF8•Ran(GDP)), 7MNW (NUP358RanBD-I•Ran(GMPPNP)), 7MNX (Nup358RanBD‑II•Ran(GMPPNP)), 7MNY (NUP358RanBD-III•Ran(GMPPNP)), 7MNZ (NUP358RanBD‑IV•Ran(GMPPNP)), 7MO0 (NUP50RanBD•Ran(GMPPNP)), 7MO1 (NUP153ZnF1•Ran(GDP)), 7MO2 (NUP153ZnF2•Ran(GDP)), 7MO3 (NUP153ZnF3•Ran(GDP), 2.05Å), 7MO4 (NUP153ZnF3•Ran(GDP), 2.4Å), 7MO5 (NUP153ZnF4•Ran(GDP)).
Near-atomic composite NPC structure with 60nm filaments as (pymol) session.
Warning, large file!