Hoelz Lab: Publications
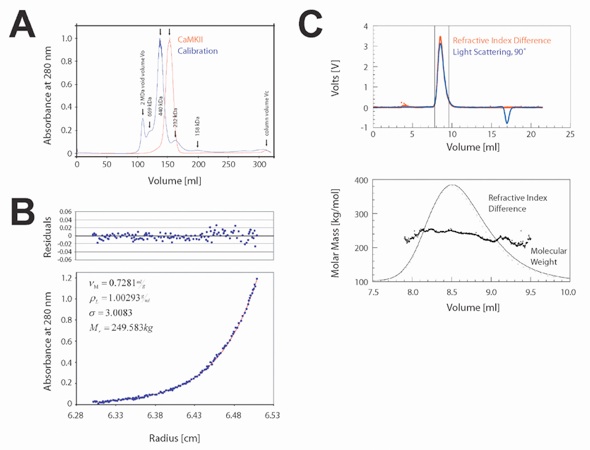
Figure 1. CaMKIIα Is Tetradecameric in Solution(A) Gel filtration profiles on Superdex 26/60 (Pharmacia) for CaMKIIα336-478. Elution positions for the void volume and five standards are shown.(B) Sedimentation equilibrium analysis of CaMKIIα327-478. The data points (blue solid circles) fall on a curve (lower panel) that describes the concentration distribution of a single ideal species. The residuals for the single exponential fit are shown in the upper panel.(C) Multiangle light scattering analysis of CaMKIIα336-478. The black bars on each side of the peak indicate the data points used for further analysis (upper panel). Molecular weights determined by light scattering from each data slice (0.5 s increments), the signal from the light scattering detector (at 90° to the incident beam; broken line), and concentration of protein is plotted against the elution time. The protein peak, as measured by change of refractive index, is shown as a solid line (lower panel). The association domain is monodisperse in solution.

Hoelz, A., Nairn, A.C., and Kuriyan, J. (2003). Mol. Cell 11, 1241-1251.
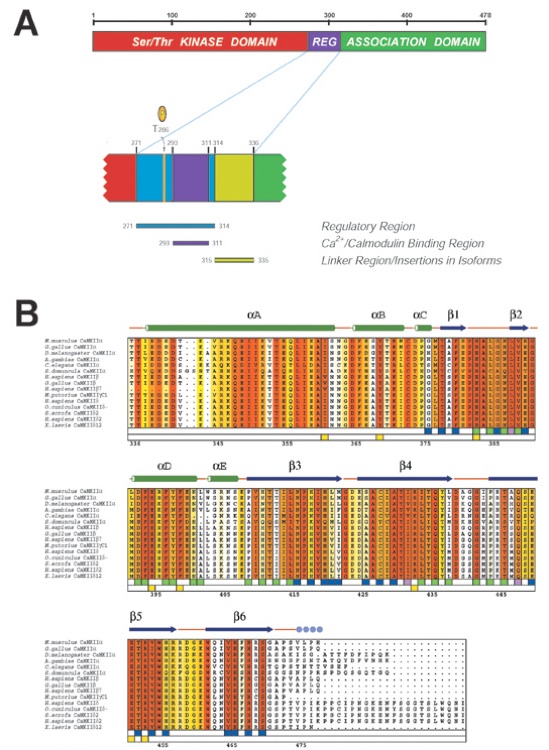
Figure 2. Organization of the CaMKII Polypeptide Chain(A) Domain structure. The kinase domain (1–272) is shown in red, the regulatory tail (273–314) is in blue, and the association domain (336–474) is in green (upper panel). The expanded lower panel shows details of the autoinhibitory region. The Ca2+/CaM binding region (293–310) is in purple, and the phosphorylation site Thr 286 is indicated with an arrow. The linker region between the autoinhibitory and association domains is shown in light green.(B) Multiple sequence alignment of association domains from different species including the α, β, γ, and δ isoforms. The secondary structure (from the crystal structure of mouse CaMKIIα) is indicated as green cylinders (α helices), purple arrows (β sheets), orange lines (coil regions), and solid blue circles (disordered residues). Numbering below the alignment is relative to mouse CaMKIIα. Overall sequence conservation at each position was calculated using the Blosum62 algorithm (Henikoff and Henikoff, 1992) and is shaded in a color gradient from light yellow (75% similarity) to dark red (100% identity). The participation of various residues in the formation of the two interfaces is indicated by blue boxes (interface between rings), light green boxes (interface in same ring), and dark green boxes (participation at both interfaces) below the aligned sequences. Yellow boxes below the sequences indicate the essentially invariant residues that are buried deep inside the core to form the potential peptide binding pocket. The figure was generated using the programs Clustal X (Jeanmougin et al., 1998) and Alscript (Barton, 1993).
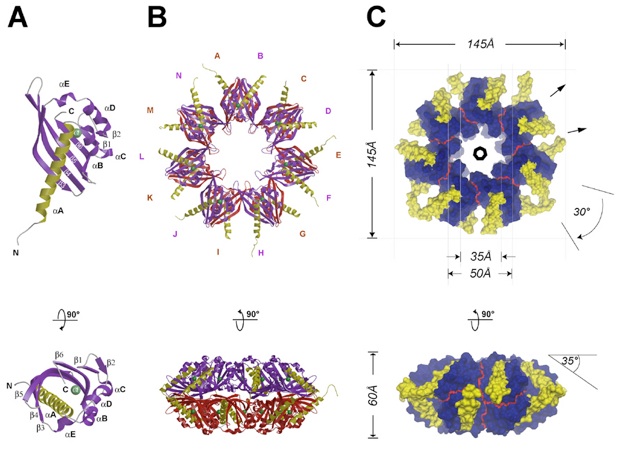
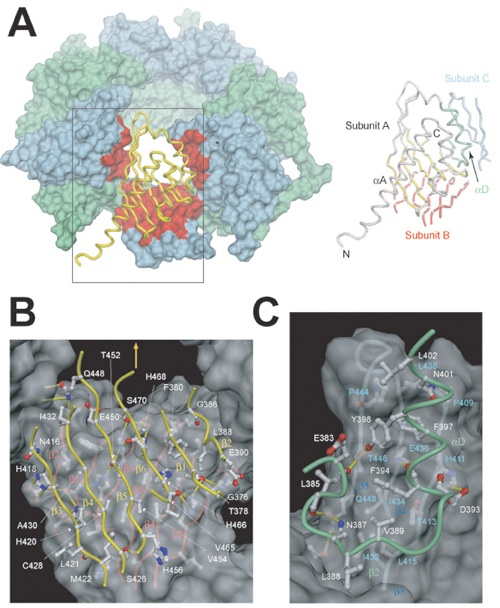
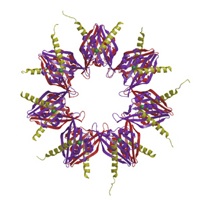
Figure 3. Overview of the CaMKII Association Domain Structure(A) Ribbon diagram of a protomer. The long N-terminal helix αA is colored yellow, the remaining structural elements are colored in purple and labeled according to Figure 2B. A chloride ion is shown in light green and marks the location of a putative peptide binding pocket (see Figure 5). The lower panel depicts a 90° rotated view, looking down into the putative binding pocket.(B) Ribbon diagrams showing two views of the association domain assembly with all 14 protomers (A–N) colored according to (A), using purple for protomers located in the upper ring and red for protomers located in the lower ring.(C) Dimensions of the CaMKII assembly. Top, view along the 7-fold axis of symmetry. All N-terminal residues and the helix αA (332-362) of all chains are shown in yellow; the remaining residues are shown in dark blue. The thin, red line indicates the interface boundary between different protomers. The 7-fold symmetry axis and the two unique 2-fold axes are indicated by a polygon and two arrows, respectively. Bottom, a 90° rotated view.Figures were generated with MOLSCRIPT (Kraulis, 1991), Raster3D (Merritt and Bacon, 1997), MSMS (Sanner et al., 1996), and Dino (http://www.dino3d.org).
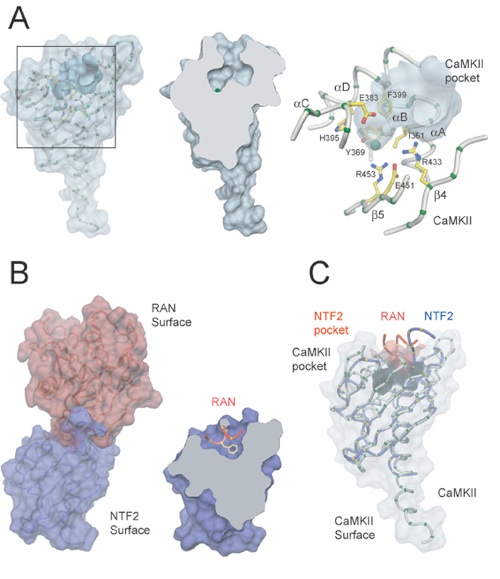
Figure 4. Potential C-Terminal Peptide Binding Pocket(A) The CaMKII binding pocket. All illustrations are from the same view. Surface representation of the protomer A (left panel), sliced open (middle panel), and close up (right panel). Only essentially invariant residues are shown. The Cα trace is shown in gray, Cα atoms in green, side chains in yellow, and the chloride ion in light green.(B) NTF2 bound to Ran•GDP. The views are similar in orientation to those in (A). NTF2 is shown in blue; Ran•GDP is shown in red. The Ran•GDP peptide is shown in red (right panel).(C) Superimposed views of the Cα traces of CaMKII and NTF2. Colors are according to (A) and (B). The Ran•GDP peptide (in red) and NTF2's pocket surface representation are shown for reference.
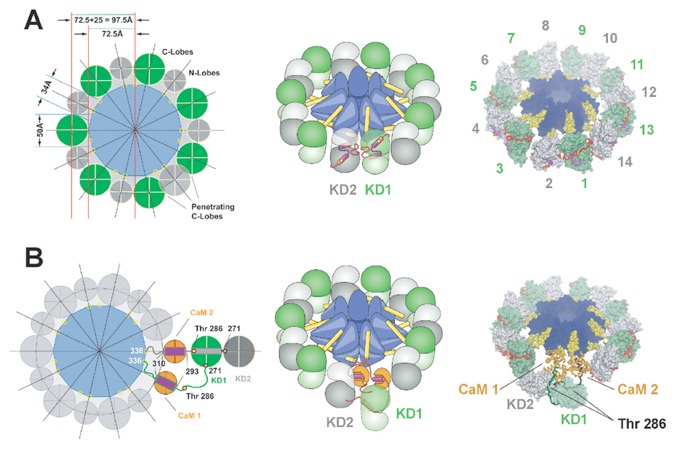
Figure 5. Models of Activation of CaMKII(A) Geometrical construction for the arrangement of the kinase domains in the autoinhibited state (left panel). The central association domain (blue) and its N-terminal regions (yellow circles), C-terminal kinase domain lobes (green circles), N-terminal kinase domain lobes (gray circles), and distances are indicated. Note, that a side by side arrangement of the C-terminal kinase domain lobes would penetrate each other. A schematic representation showing the arrangement of the autoinhibited titin kinase domains around the association domain, indicating the autoinhibitory segments of kinase domain 1 and 2 (KD1 and KD2) is shown in the middle panel. The right panel shows the corresponding atomic model using the atomic coordinates of autoinhibited titin kinase (see Supplemental Figure S2 at http://www.molecule.org/cgi/content/full/11/5/1241/DC1) and the association domain generated based on the steric constraints discussed in the text.(B) Geometrical construction for the activation of a closer pair of kinase domains (left panel). Colors are according to (A) with the addition of Ca2+/CaM/CaMKII complexes and Thr 286 (yellow circles). The middle and right panels show a schematic representation and the corresponding atomic model. In the atomic model, the tail of KD1 is shown in green and that of KD2 is in gray.
Figures from the paper:
Coordinates:
Abstract:
We report the crystal structure of the 143 residue association domain of Ca2+/calmodulin-dependent protein kinase II (CaMKII). The association domain forms a hub-like assembly, composed of two rings of seven protomers each, which are stacked head to head and held together by extensive interfaces. The tetradecameric organization of the assembly was confirmed by analytical ultracentrifugation and multiangle scattering. Individual protomers form wedge-shaped structures from which N-terminal helical segments that connect to the kinase domain extent toward the equatorial plane of the assembly, consistent with the arrangement of the kinase domains in a second outer ring. A deep and highly conserved pocket present within the association domain may serve as a docking site for proteins that interact with CaMKII.
Figure S1. Interfaces in the Association Domain Assembly(A) Surface representation of the tetradecameric association domain. One protomer (protomer A) is shown as a yellow worm. Interacting interfaces on adjacent protomers are colored in red; all other protomers are in light blue and light green. The worm representation in the right panel is colored according to that in (B) and (C).(B) Detailed view of the interface between protomers of the two seven-membered rings. The worm representation of protomer A is shown in yellow and for protomer B in red. A 2-fold symmetry axis lies perpendicular to the interface and is indicated by the orange arrow. For simplicity, only side chains from protomer A are labeled.(C) Detailed view of the interface between protomers of a single seven-membered ring. The worm representation for protomer A is in green and that for protomer C in light blue. Side chain residues are labeled in white for protomer A and in blue for protomer C. Figures were generated with MSMS (Sanner et al., 1996) and Dino (Dino, 2002).
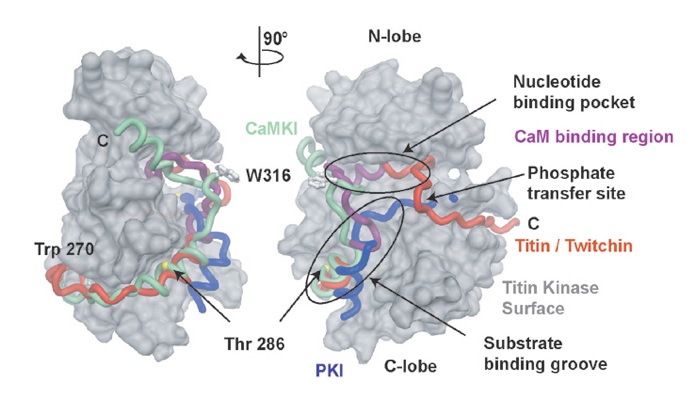
Figure S2. Atomic Models of Auto-Inhibited Kinase DomainsTwo views of surface representations of the kinase domain of titin kinase (residues 18-276). Models showing the C-terminal auto-inhibitory extension of CaMKI (green, PDB code 1AO6) and titin kinase (red, PDB code 1TK1) are shown from a conserved tryptophan residue at the back of the kinase domain (Trp 275 CaMKI, Trp 277 titin kinase). As a reference, the PKI inhibitor of PKA (blue, PDB code 1APM) is shown modeled into the titin kinase domain (Knighton et al., 1991) to show the position of the substrate binding groove and phosphate transfer site. The approximate position of the Thr 286 phosphorylation site in CaMKII is shown as a yellow sphere relative to CaMKI. The position of the equivalent Ca2+/CaM binding region is shown as a purple segment in the titin kinase auto-inhibitory tail.

Crystal Structure of a Tetradecameric Assembly of the Association Domain of Ca2+/Calmodulin-Dependent Kinase II
California Institute of Technology
Division of Chemistry & Chemical Engineering
1200 E. California Blvd.
Pasadena, CA 91125-7200
© Copyright Hoelz Laboratory
