Hoelz Lab: Publications
Fig. 1. Reconstitution and Dissection of the IRC. (A) Cross-sectional schematic representation of the NPC and domain structures of the Chaetomium thermophilum nucleoporins (nups). Black lines indicate regions used for reconstitution. U, unstructured; T, TAIL; NTD, N-terminal domain; MID, middle domain; SH3, Src-homology 3-like domain; L, linker domain; APD, auto-proteolytic domain; RRM, RNA recognition motif; M, membrane-binding motif; FG repeats, phenylalanine-glycine repeats; CCS, coiled-coil segment; α/β, α/β insertion domain; IRC, inner ring complex. (B to I) Pair-wise biochemical interaction analyses of various reconstituted nup complexes. Size-exclusion chromatography coupled to multiangle light scattering (SEC-MALS) profiles of nup or nup complexes are shown individually (red and blue) and after their preincubation (green). Measured molecular masses are indicated for the peak fractions. (J) Structure of the Nup82NTD•Nup159T•Nup145NAPD cytoplasmic filament nup complex (CFC) is shown in a cartoon representation. Nup145NAPD (green), Nup159T (red), and Nup82NTD (blue), the Nup82NTD helical 4CD (gray) and 6CD (orange) insertions and FGL loop (yellow), and the conserved Nup145NAPD K/R loop (purple) are illustrated.

PDB coordinates (link to PDB site): Nup170NTD•Nup53R3 (5HAX), Nup170CTD (5HAY), Nup170CTD (5HAZ), Nup170CTD•Nup145NR3 (5HB0), Nup170SOL (5HB1), Nic96SOL (5HB2), Nic96SOL•Nup53R2 (5HB3), Nup192ΔHEAD (5HB4), Nup145NAPD (5HB5), Nup145NAPD•Nup145CN (5HB6), Nup53RRM, space group P212121 (5HB7), and Nup53RRM space group P3121 (5HB8)
PDBCoordinates: (.pdb): Nup170NTD•Nup53R3 (5HAX), Nup170CTD (5HAY), Nup170CTD (5HAZ), Nup170CTD•Nup145NR3 (5HB0), Nup170SOL (5HB1), Nic96SOL (5HB2), Nic96SOL•Nup53R2 (5HB3), Nup192ΔHEAD (5HB4), Nup145NAPD (5HB5), Nup145NAPD•Nup145CN (5HB6), Nup53RRM, space group P212121 (5HB7), and Nup53RRM, space group P3121 (5HB8)
Structure Factors: (.txt): Nup170NTD•Nup53R3 (5HAX), Nup170CTD (5HAY), Nup170CTD (5HAZ), Nup170CTD•Nup145NR3 (5HB0), Nup170SOL (5HB1), Nic96SOL (5HB2), Nic96SOL•Nup53R2 (5HB3), Nup192ΔHEAD (5HB4), Nup145NAPD (5HB5), Nup145NAPD•Nup145CN (5HB6), Nup53RRM, space group P212121 (5HB7), and Nup53RRM, space group P3121 (5HB8)
Coordinates:
Abstract:
The nuclear pore complex (NPC) constitutes the sole gateway for bidirectional nucleocytoplasmic transport. We present the reconstitution and interdisciplinary analyses of the ~425-kDa inner ring complex (IRC), which forms the central transport channel and diffusion barrier of the NPC, revealing its interaction network and equimolar stoichiometry. The Nsp1•Nup49•Nup57 channel nucleoporin hetero-trimer (CNT) attaches to the IRC solely through the adaptor nucleoporin Nic96. The CNT•Nic96 structure reveals that Nic96 functions as an assembly sensor that recognizes the three dimensional architecture of the CNT, thereby mediating the incorporation of a defined CNT state into the NPC. We propose that the IRC adopts a relatively rigid scaffold that recruits the CNT to primarily form the diffusion barrier of the NPC, rather than enabling channel dilation.
California Institute of Technology
Division of Chemistry & Chemical Engineering
1200 E. California Blvd.
Pasadena, CA 91125-7200
© Copyright Hoelz Laboratory

Architecture of the fungal nuclear pore inner ring complex

Stuwe, T.,# Bley, C.J. ,# Thierbach, K., # Petrovic, S., # Schilbach, S., Mayo, D.J., Perriches, T., Rundlet, E.J., Jeon, Y.J., Collins, L.N., Huber, F.M., Lin, D.H., Paduch, M., Koide, A., Lu, V., Fischer, J., Hurt, E., Koide, S., Kossiakoff, A., Hoelz, A.*
(2015). Science, 350, 56-64
Figures from the paper:

Fig. S7. Multispecies sequence alignment of Nup192TAIL. Sequences from six diverse fungal species were aligned and colored by sequence similarity according to the BLOSUM62 matrix from white (less than 40 % similarity), to yellow (40 % similarity), to red (100 % identity). Numbering below alignment is relative to C. thermophilum. Secondary structure observed in the Nup192TAIL structure is shown above the alignment; α-helices (blue bars) and black lines (unstructured regions). Residues tested for their ability to interact with Nic96 in a mutational analysis (Figures 2 and S12) are indicated with dots below the alignment and colored according to the measured effect; no effect (green), mild effect (orange), abolished binding (red).
Fig. S9. Multispecies sequence alignment of Nup188TAIL. Sequences from seven diverse fungal species were aligned and colored by sequence similarity according to the BLOSUM62 matrix from white (less than 40 % similarity), to yellow (40 % similarity), to red (100 % identity). Numbering below alignment is relative to C. thermophilum. Secondary structure observed in the Nup188TAIL structure is shown above the alignment; α-helices (blue bars) and black lines (unstructured regions).


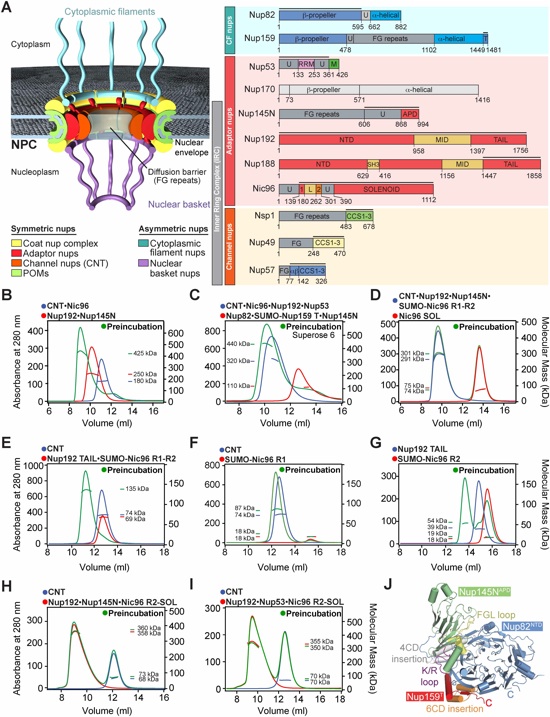
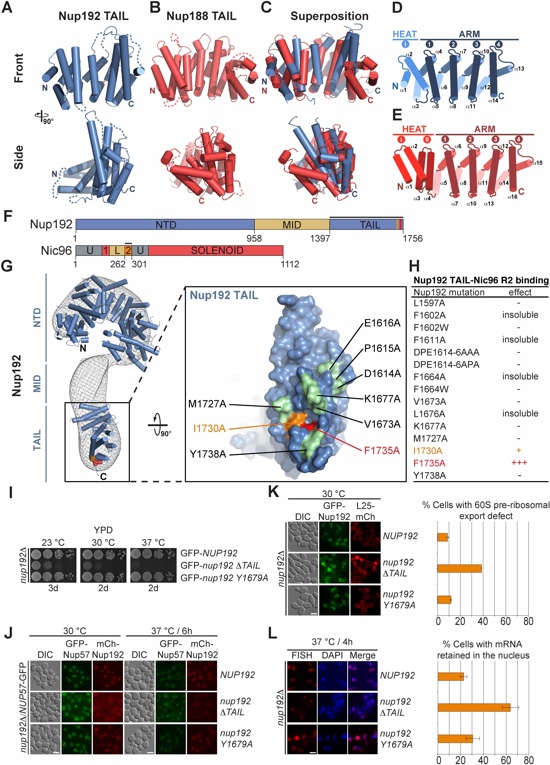
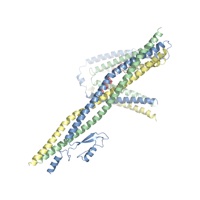
Fig. 2. Structural and functional analyses of the TAIL domains of Nup192 and Nup188. Cartoon representations of (A) Nup192TAIL (blue), (B) Nup188TAIL (red), and (C) a superposition of the two structures is shown in two different orientations. (D, E) Schematic representation of Nup192TAIL and Nup188TAIL structures. Positions of HEAT and ARM repeats are indicated. (F) Domain structures of Nup192 and Nic96 are shown; black bars indicate fragments used for interaction studies in (H). (G) Docking of Nup192TAIL and the previously determined Nup192NTD crystal structure into the yeast Nup192 EM envelope (8, 32). The Inset illustrates the position of Nup192TAIL and is expanded on the right, rotated by 90º. Surface representation of Nup192TAIL with the location of the analyzed mutations and their effect on Nic96R2 binding indicated; no effect (green), decreased binding (orange), abolished binding (red). (H) Summary of tested Nup192TAIL mutants and their effect on SUMO-Nic96R2 binding; (-) no effect, (+) decreased binding, (+++) abolished binding. (I) Growth analysis of S. cerevisiae strains carrying the indicated GFP-NUP192 variants. Serial dilutions of the respective cells were spotted onto YPD plates and grown for 2-3 days. (J) Subcellular localization of mCherry-Nup192 variants (red) and Nup57-GFP (green) in a nup192Δ/NUP57-GFP strain. (K) Subcellular localization of the 60S ribosomal export reporter Rpl25-mCherry (red) and GFP-tagged Nup192 variants (green) in a nup192Δ strain. Representative images and quantification of nuclear Rpl25-mCherry retention are shown on the right. (L) mRNA export assay in a nup192Δ strain carrying GFP-NUP192 variants. Representative images and quantification of nuclear poly(A)+ RNA retention are shown. Cells were analyzed at the indicated temperatures and incubation times. Error bars represent the standard deviation. Scalebars are 5 μm.

Fig. 3. Nic96 is an adaptor protein that attaches the CNT to Nup192. (A) Domain structure of Nic96 is shown. R1, region 1; R2, region 2. (B) The positions of the mutated leucine residues of the LLLL mutant are indicated below the primary Nic96R1 sequence. SEC-MALS profiles of CNT (black), Nic96R1 LLLL mutant (blue) and after preincubation of the CNT with wild type Nic96R1 (green) or Nic96R1 LLLL (red). Measured molecular masses are indicated for the peak fractions. (C) The positions of the mutated residues are indicated below the primary Nic96R2 sequence and colored according to their effect on Nup192TAIL binding; no effect (green), mild effect (orange), abolished binding (red). SEC profiles of Nup192TAIL preincubated with wild type Nic96R2 (green), Nic96R2 I294A (orange), and Nic96R2 F298A (red). (D) Growth analysis of S. cerevisiae strains carrying the indicated GFP-NIC96 variants. Serial dilutions of the respective cells were spotted onto indicated plates and grown for 3-5 days at the specified temperatures. (E) Subcellular localization of mCherry-Nic96 variants (red) and Nup57-GFP (green) in a nic96Δ/NUP57-GFP strain. (F) mRNA export assay in a nic96Δ/NUP57-GFP strain carrying GFP-NIC96 variants. Representative images and quantification of nuclear poly(A)+ RNA retention are shown. (G) Subcellular localization of the 60S ribosomal export reporter Rpl25-mCherry (red) and GFP-tagged Nup49 variants (green) in a nic96Δ strain. Quantification of nuclear Rpl25-mCherry retention is shown on the right. Cells were analyzed at the indicated temperatures and incubation times. Error bars represent the standard deviation. Scalebars are 5 μm.

Fig. 4. Crystal structure of the intact Nsp1•Nup49•Nup57 CNT bound to Nic96R1 and sAB-158. (A) Domain structures of the C. thermophilum channel nups Nsp1, Nup49, Nup57, the adaptor nup Nic96, and sAB-158. Black lines indicate the construct boundaries of the crystallized CNT•Nic96R1•sAB-158 complex. The constructs of the three channel nups comprise all regions with predicted secondary structure elements and only lack their unstructured N-terminal FG repeat regions. VH, heavy chain variable region; CH, heavy chain constant region; VL, light chain variable region; CL, light chain constant region. (B) Cartoon representation of the Nic96R1•CNT crystal structure viewed from three sides. For clarity, sAb-158 has been omitted. (C) Details of the Nic96R1-CNT interaction, illustrating the three channel nups and Nic96R1 in surface and cartoon representation, respectively. The Inset marks the region enlarged and 90º rotated in the middle panel. A further 90º rotated view is shown on the right. Nic96R1 (red) and Nup49 (magenta) residues that abolish CNT-Nic96R1 complex formation upon mutation (Figures 3 and 5) are indicated. (D) Structure of the CNT•Nic96R1•sAB-158 dimer shown in cartoon representation. The two copies of the CNT, Nic96R1, and sAB-158 are shown in blue/yellow, magenta/red, and gray, respectively. A 90º rotated view is shown on the right. The two CNT•Nic96R1•sAB-158 complexes in the asymmetric unit are related by two-fold rotational symmetry (black oval). Notably, the N-termini of all channel nups in the dimer point in the same direction, which would permit the FG repeats to project towards the central transport channel of the NPC.
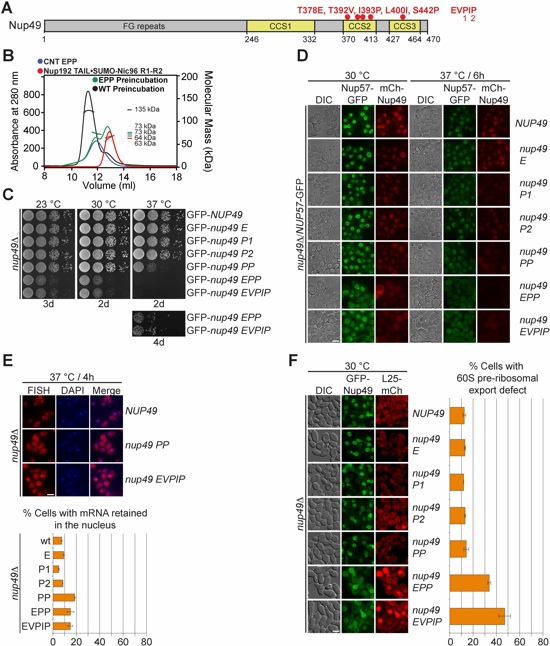
Fig. 5. The intact CNT is recruited to the NPC by its interaction with Nic96. (A) Domain structure of Nup49, indicating the corresponding EVPIP mutations (red) of the S. cerevisiae nup49-313 allele (37). (B) SEC-MALS profiles of the CNTEPP mutant (blue), Nic96R1-R2•Nup192TAIL (red) and after their preincubation (green). As reference, wild type CNT•Nic96R1-R2•Nup192TAIL is shown (black). Measured molecular masses are indicated for the peak fractions. (C) Growth analysis of S. cerevisiae strains carrying the indicated GFP-NUP49 variants. Serial dilutions of the respective cells were spotted onto YPD plates and grown for 2-4 days at the specified temperatures. (D) Subcellular localization of mCherry-Nup49 variants (red) and Nup57-GFP (green) in a nup49Δ/NUP57-GFP strain. (E) mRNA export assay in a nup49Δ strain carrying GFP-NUP49 variants. Representative images and quantification of nuclear poly(A)+ RNA retention are shown. (F) Subcellular localization of the 60S ribosomal export reporter Rpl25-mCherry (red) and GFP-tagged Nup49 variants (green) in a nup49Δ strain. Quantification of nuclear Rpl25-mCherry retention is shown on the right. Cells were analyzed at the indicated temperatures and incubation times. Error bars represent the standard deviation. Scalebars are 5 μm.
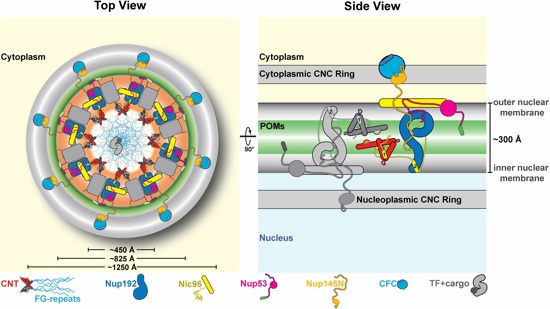
Fig. 6. Proposed architecture of the NPC inner ring scaffold. Sixteen copies of the IRC are anchored to the nuclear pore membrane and arranged in a ring-shaped scaffold in an anti-parallel fashion to satisfy the established 8-fold and 2-fold symmetry axes of the NPC. Each IRC is composed of the channel nucleoporins Nsp1, Nup49, and Nup57 (CNT, red), the adaptor nucleoporins Nup192 (blue), Nic96 (yellow), Nup53 (magenta), and Nup145N (orange). The cytoplasmic and nuclear CNC rings (gray), the putative location of the POMs (green), and the inner ring (red) are shown. On the cytoplasmic side, Nup145N attaches the cytoplasmic filament nucleoporins Nup82 and Nup159 (CFC, cyan). The primarily unstructured adaptor nucleoporins Nup53 and Nup145N mediate the association of various structured IRC components and thus are critical for the IRC scaffold integrity. Nic96 functions as an assembly sensor that recognizes the conformation of the overall 4-shaped three-stranded coiled-coil domain architecture of the CNT, thereby mediating the selective incorporation of a defined CNT state into the NPC. The CNTs are positioned in the equatorial plane of the inner ring with the FG repeats of all three channel nups projecting towards the central transport channel. The anti-parallel orientation of adjacent IRCs would generate two CNT rings, one at the top and another at the bottom of the central transport channel. This arrangement would allow for the formation of a transport factor mediated FG repeat meshwork or hydrogel, which would further reinforce the inner ring scaffold. For size reference, a β-karyopherin•cargo complex is shown in gray.
Fig. S1. Reconstitution and dissection of the IRC. (A to H) SEC-MALS and SDS-PAGE analysis corresponding to Figure 1. SEC-MALS profiles of nucleoporins or nup complexes are shown individually (red and blue) and after their preincubation (green). Measured molecular masses are indicated for the peak fractions. Gray bars indicate fractions that were resolved on SDS-PAGE gels and visualized by Coomassie staining.
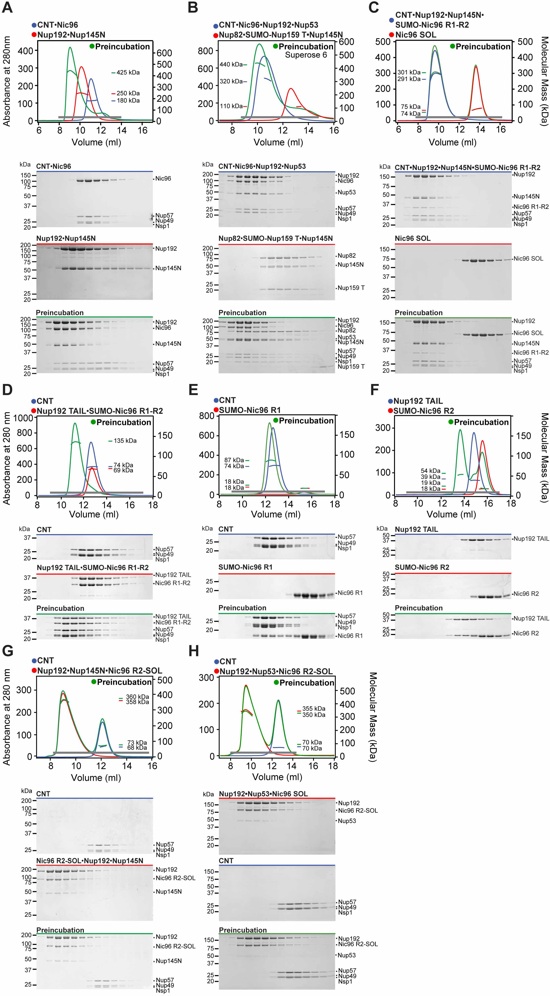

Fig. S2. Reconstitution and dissection of the IRC (continued). (A to F) SEC-MALS and SDS-PAGE analysis corresponding to Figure 1. SEC-MALS profiles of nucleoporins or nup complexes are shown individually (red and blue) and after their preincubation (green). Measured molecular masses are indicated for the peak fractions. Gray bars indicate fractions that were resolved on SDS-PAGE gels and visualized by Coomassie staining.

Fig. S3. Structure of the minimal CFC in complex with Nup145NAPD. (A) Structure of the Nup82NTD•Nup159T•Nup145NAPD hetero-trimer shown in cartoon representation. Nup145NAPD (green), Nup159T (red), and Nup82NTD (blue), the Nup82NTD helical 4CD (grey) and 6CD (orange) insertions and FGL loop (yellow), and the conserved Nup145NAPD K loop (purple) are illustrated. (B) Structure of the previously determined scNup82NTD•scNup159T•mmNup145NAPD hetero-trimer (PDB ID: 3TKN) shown in cartoon representation (67). (C) Superposition of the two hetero-trimers in cartoon representation, revealing the evolutionary conservation of their architectures, and differing mainly by an angular displacement of Nup145APD. (D) The Inset marks the location of the two close-up views, depicting the molecular details of the Nup145NAPD-Nup82NTD interaction (top) and the Nup159T-Nup82NTD interaction (bottom). The D pocket that binds the K loop is indicated. (E) Sequence alignments of the conserved S. cerevisiae and C. thermophilum Nup159T, the Nup82NTD FGL loop, and the Nup145N K/R loop. Sequence similarity is shaded from white (less than 60 % similarity), to yellow (60 % similarity), to red (100 % identity) using the BLOSUM62 matrix. Numbering below alignment is according to the C. thermophilum proteins. Secondary structure is shown above the alignment.
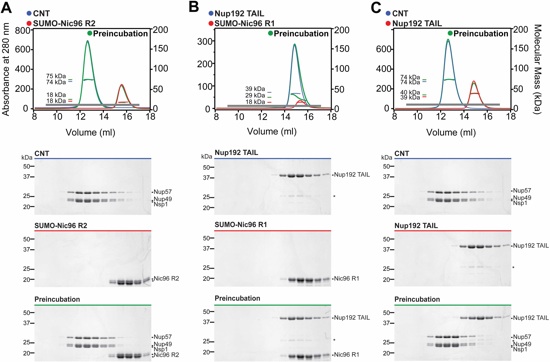
Fig. S4. The CNT does not interact with Nic96R2 or Nup192TAIL, nor does Nic96R1 bind Nup192TAIL. (A to C) SEC-MALS profiles of nucleoporins or nup complexes are shown individually (red and blue) and after their preincubation (green). Measured molecular masses are indicated for the peak fractions. Gray bars indicate fractions that were resolved on SDS-PAGE gels and visualized by Coomassie staining. Asterisks indicate degradation products or contamination.
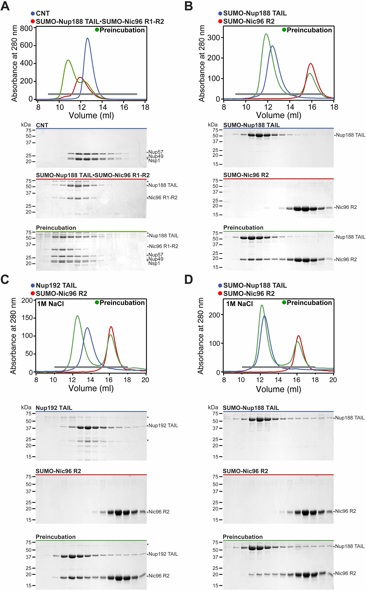
Fig. S5. Nup188TAIL forms an alternative complex with the CNT. (A) Reconstitution of SUMO-Nup188TAIL•SUMO-Nic96R1-R2•CNT. (B) Reconstitution of SUMO-Nup188TAIL•SUMO-Nic96R2. (C, D) SEC analysis of Nup192TAIL•SUMO-Nic96R2 and SUMO-Nup188TAIL•SUMO-Nic96R2 carried out in a 1 M NaCl buffer. SEC profiles of nucleoporins or nup complexes are shown individually (red and blue) and after their preincubation (green). Gray bars indicate fractions that were resolved on SDS-PAGE gels and visualized by Coomassie staining. Asterisks indicate degradation products or contamination.
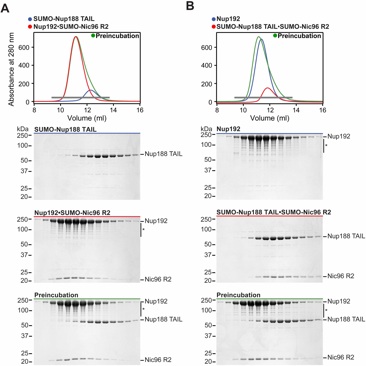
Fig. S6. Binding of Nup192 and Nup188 to Nic96 is mutually exclusive. (A) SEC interaction analysis of SUMO-Nup188TAIL challenging a preformed Nup192•SUMO-Nic96R2 complex. (B) SEC interaction analysis of Nup192 challenging a preformed SUMO-Nup188TAIL•SUMO-Nic96R2 complex. SEC profiles of nucleoporins or nup complexes are shown individually (red and blue) and after their preincubation (green). Proteins were mixed at equimolar ratios. Gray bars indicate fractions that were resolved on SDS-PAGE gels and visualized by Coomassie staining. Asterisks indicate degradation products or contamination.
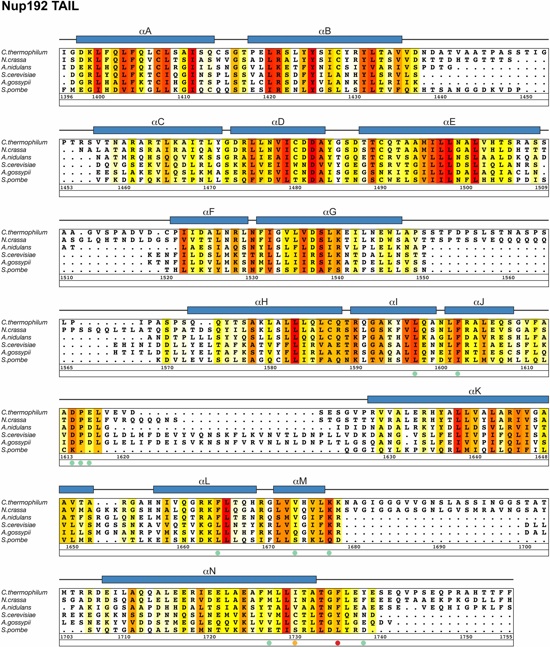
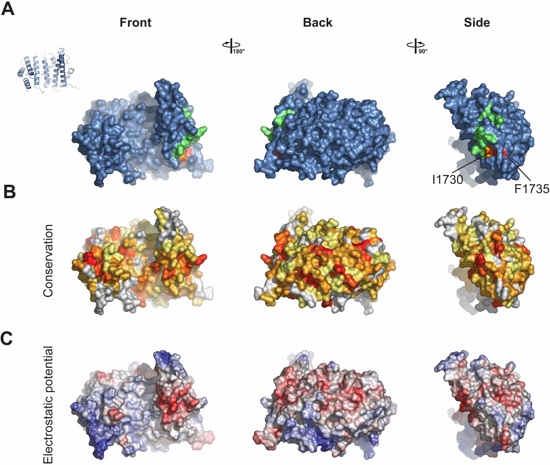
Fig. S8. Surface properties of Nup192TAIL. Surface representation of Nup192TAIL is shown in three different orientations, front, back and side. The degree of rotation around the vertical axis is indicated between the respective views. (A) Mutated Nup192TAIL residues are colored according to their effect on SUMO-Nic96R2 binding; no effect (green), mild effect (orange), abolished binding (red). (B) Surface representation colored according to sequence identity based on the alignment in Figure S7. (C) Surface representation colored according to electrostatic potential from ‑10 kBT/e (red) to +10 kBT/e (blue).


Fig. S10. Surface properties of Nup188TAIL. Surface representation of Nup188TAIL is shown in three different orientations, front, back and side. Rotations around the vertical axis are indicated between the respective views. (A) Surface representation colored according to sequence identity based on alignment in Figure S9. (B) Surface representation colored according to electrostatic potential from ‑10 kBT/e (red) to +10 kBT/e (blue).

Fig. S11. Comparison of ctNup188TAIL and mtNup188TAIL structures. Cartoon representations of (A) C. thermophilum Nup188TAIL (red), (B) M. thermophila Nup188TAIL (grey) (PDB ID: 4KF8) (68), and (C) a superposition of the two structures is shown in two different orientations.

Fig. S12. Identification of Nup192TAIL mutations that disrupt SUMO-Nic96R2 binding. (A) SEC interaction analysis between Nup192TAIL mutants and SUMO-Nic96R2. SEC profiles are colored according to the effect on SUMO-Nic96R2 binding; no effect (gray), mild effect (orange), or abolished binding (red). As reference, the wild type complex is shown (green). A gray bar indicates fractions that were resolved on SDS-PAGE gels and visualized by Coomassie staining. (B) Summary of tested Nup192TAIL mutants and their effect on SUMO-Nic96R2 binding; (-) no effect, (+) decreased binding, (+++) abolished binding. The colors of the dots correspond to the color of the respective SEC profile in (A).

Fig. S13. Multispecies sequence alignment of Nic96R1-R2. Sequences from eight diverse species were aligned and colored by sequence similarity according to the BLOSUM62 matrix from white (less than 40 % similarity), to yellow (40 % similarity), to red (100 % identity). Numbering below alignment is relative to C. thermophilum. The secondary structure is shown above the alignment; α-helices are represented by blue bars. Black bars above the alignment indicate CNT-binding (R1) and Nup192-binding regions (R2). Dots below the alignment indicate the positions of mutations tested for CNT or Nup192TAIL binding (Figures 3, S15, and S16); no effect (green), mild effect (orange), abolished binding (red).
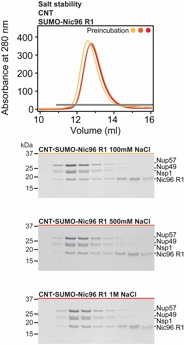
Fig. S14. Salt stability of the CNT•SUMO-Nic96R1 complex. SEC analysis of purified CNT•SUMO-Nic96R1 carried out in a buffer containing 0.1 M (yellow), 0.5 M (light orange) or 1.0 M NaCl (red). A gray bar indicates fractions that were resolved on a SDS-PAGE gel and visualized by Coomassie staining.
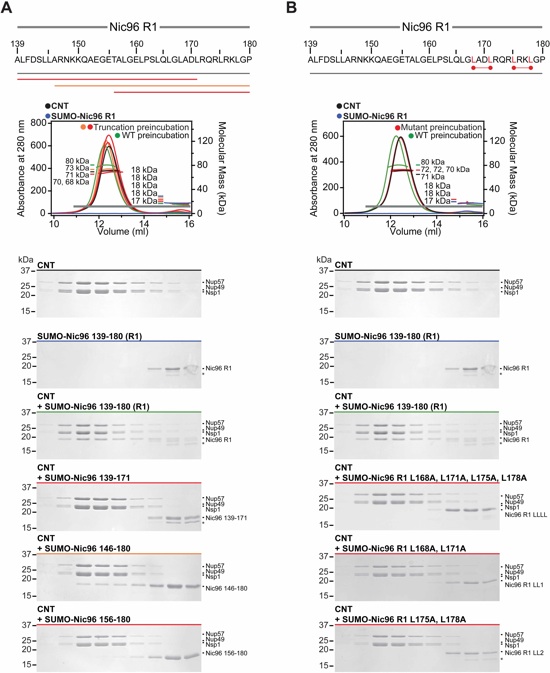
Fig. S15. Mapping and mutational analysis of the minimal Nic96R1 region required for CNT binding. (A, B) Analyzed Nic96R1 truncations and Nic96R1 leucine-alanine mutants are indicated below the primary Nic96R1 sequence. SEC-MALS profiles of SUMO-Nic96R1 fragments or mutants preincubated with CNT are shown and colored according to their effect on complex formation; mild effect (orange) or abolished binding (red). As reference, SEC profiles of CNT (black) and SUMO-Nic96R1 (blue) and their preincubation (green) are shown. Measured molecular masses are indicated for the peak fractions. Gray bars indicate fractions that were resolved on SDS-PAGE gels and visualized by Coomassie staining. LL1, LL2, and LLLL refer to the three combinations of SUMO-Nic96R1 leucine-alanine mutants tested. Asterisks indicate degradation products or contamination.
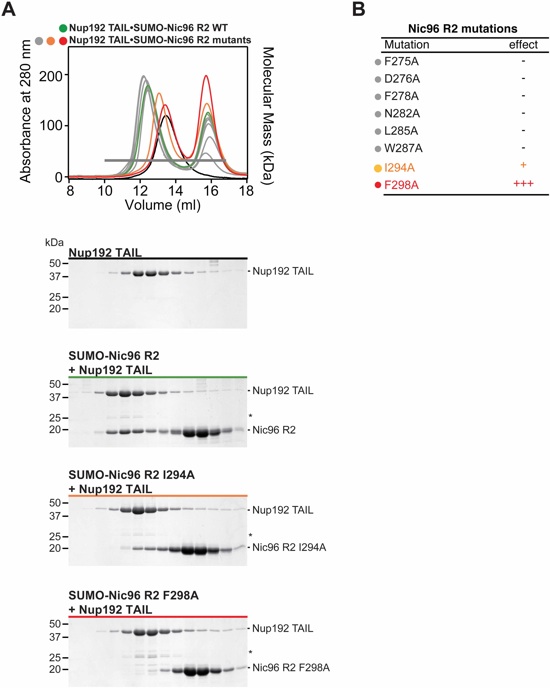
Fig. S16. Identification of Nic96R2 mutations that disrupt Nup192TAIL binding. (A) SEC interaction analysis between SUMO-Nic96R2 mutants and Nup192TAIL. SEC profiles are colored according to the effect on Nup192TAIL binding; no effect (gray), mild effect (orange), or abolished binding (red). For reference, SEC profiles of wild type Nup192TAIL•SUMO-Nic96R2 (green) and Nup192TAIL (black) are shown. A gray bar indicates fractions that were resolved on SDS-PAGE gels and visualized by Coomassie staining. (B) Summary of tested SUMO-Nic96R2 mutants and their effect on Nup192TAIL binding; (-) no effect, (+) decreased binding, (+++) abolished binding. The colors of the dots correspond to the color of the respective SEC profile in (A).

Fig. S17. S. cerevisiae GFP-Nic96 and mCherry-Nic96 constructs used for in vivo analyses. The domain architecture of S. cerevisiae Nic96 is shown and colored according to Figure 1. Black lines indicate the regions that were removed in various Nic96 deletion mutants. The positions of the F159A and LLLL mutants that abolish Nup192 and CNT binding, respectively, are highlighted in yellow.

Fig. S18. Characterization of channel nucleoporin fragments and the intact CNT. (A) Domain structures of the three CNT-forming channel nups from H. sapiens, R. norvegicus, and C. thermophilum. Bars indicate the boundaries of the crystallized Nup57 (blue, orange), Nup49 (yellow), and Nsp1 (green) fragments. (B) Crystal structures of seven channel nup fragments in isolation or in complex colored according to (A). The species and fragment stoichiometry are indicated for each structure. For clarity, only the homo-dimers of H. sapiens and R. norvegicus Nup49CCS2+3* are shown. The structures of Nup57CCS3*, hsNup57CCS3* (two different states), hsNup49CCS2+3*, and hsNup49CCS2+3*•hsNup57CCS3* (with 1:2 and 2:2 stoichiometry) reported here are indicated with blue dots. The previously determined structure of rnNup57CCS1*•rnNsp1CCS1* (1:2 stoichiometry), rnNup57CCS3*, rnNup49CCS2+3*, and rnNup49CCS2+3*•rnNup57CCS3* (with 1:2 stoichiometry) are marked with red dots (69-71). (C) SEC-MALS profiles of the CNT at three different concentrations (yellow to red). Asterisks indicate that the crystallized channel nup fragments do not exactly correspond to the predicted coiled-coil regions. (D) SEC-MALS interaction analysis of CNT (red), SUMO-Nic96R1 (blue), and after their preincubation (green). Measured molecular masses are indicated for the peak fractions. Gray bars indicate fractions that were resolved on SDS-PAGE gels and visualized by Coomassie staining. (E) GST pull-down interaction analysis of Nsp1, Nup49•Nup57 or the premixed CNT with GST-Nic96R1 or GST as bait. The input, PreScission protease elution, and post-elution beads were analyzed by SDS-PAGE and Coomassie staining. Nic96R1 specifically pulls-down the intact CNT and fails to interact with Nsp1 or Nup49•Nup57.
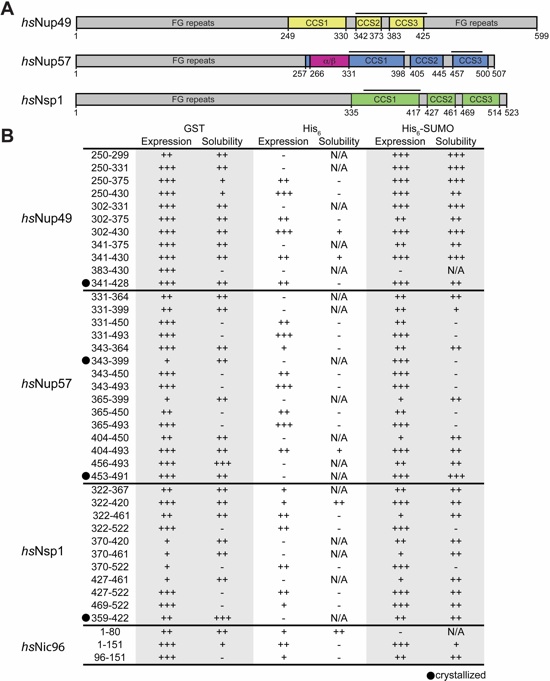
Fig. S19. Expression and solubility analysis of H. sapiens channel nups. (A) Domain architecture of the three human channel nups Nup49 (yellow), Nup57 (blue/purple), and Nsp1 (green) are shown. (B) The expression and solubility levels of individual CNT-fragments expressed as GST-fusions, hexahistidine (HIS6) or HIS6-SUMO tagged proteins are indicated; not expressed, insoluble (-) to highly expressed, highly soluble (+++). Crystallized fragments are highlighted with a black bar and a black dot.


Fig. S20. Expression and solubility analysis of C. thermophilum channel nups. (A) Domain architecture of the three C. thermophilum channel nups are shown and colored according to Figure S19. (B) The expression and solubility levels of individual CNT-fragments expressed as GST-fusions, hexahistidine (HIS6) or HIS6-SUMO tagged tagged proteins are indicated; not expressed, insoluble (-) to highly expressed, highly soluble (+++). Crystallized fragments are highlighted with a black bar and a black dot.
Fig. S21. Expression and solubility analysis of S. cerevisiae channel nups. (A) Domain architecture of the three C. thermophilum channel nups are shown and colored according to Figure S19. (B) The expression and solubility levels of individual CNT-fragments expressed as GST-fusions, hexahistidine (HIS6) or HIS6-SUMO tagged tagged proteins are indicated; not expressed, insoluble (-) to highly expressed, highly soluble (+++). Crystallized fragments are highlighted with a black bar and a black dot.

Fig. S22. Biochemical and structural analysis of different hsNup49CCS2+3* and hsNup57CCS3* complexes reveal different oligomerization states. (A) Domain architecture of hsNup49 and hsNup57 is shown and colored according to Figure S19. (B) SEC-MALS profiles of hsNup49CCS2+3* are shown at increasing protein concentrations (yellow to red). (C) SEC-MALS profiles of hsNup57CCS3* and hsNup49CCS2+3* are shown individually (blue and yellow) and after their preincubation (green). Measured molecular masses are indicated for the peak fractions. Gray bars indicate fractions that were resolved on SDS-PAGE gels and visualized by Coomassie staining. Colored bars indicate the fractions that were pooled for crystallization. (D) Crystallization drop showing two different crystal forms of the hsNup57CCS3*•hsNup49CCS2+3* complex with 1:2 (purple) and 2:2 (magenta) stoichiometry. (E) The structure of the three different homo-oligomers of hsNup49CCS2+3* (elongated homo-tetramer, compact homo-tetramer, and homo-dimer), the homo-tetramer of hsNup57CCS3*, and the hsNup57CCS3*•hsNup49CCS2+3* complexes with 2:1 and 2:2 stoichiometry are shown from left to right.

Fig. S23. Biochemical and structural analysis of the Nup57CCS3* segment from different species. (A) Domain architectures of the C. thermophilum, H. sapiens, and R. norvegicus Nup57 are shown and colored according to Figure S19. SEC-MALS profiles of (B) Nup57CCS3* and (C) hsNup57CCS3*. Measured molecular masses are indicated for the peak fractions. Gray bars indicate fractions that were resolved on SDS-PAGE gels and visualized by Coomassie staining. (D) Structures of human and C. thermophilum Nup57CCS3* shown in cartoon representation, shown in the same orientations as the previously determined rat Nup57CCS3* (70). Two different states of hsNup57CCS3* were obtained in different crystal packing arrangements. (E) Structural comparison of the R. norvegicus and C. thermophilum Nup57CCS3* homo-tetramers. The Nup57CCS3* and hsNup57CCS3* homo-tetramers possess different helical packing arrangements and fail to superpose. As a reference, two corresponding residues Q473 (red) and Y293 of the C. thermophilum and R. norvegicus homo-tetramers, respectively, are indicated, illustrating their distinct helical packing. Notably, the C. thermophilum Nup57CCS3* is homo-dimeric in solution, whereas the human homologue forms a homo-tetramer.
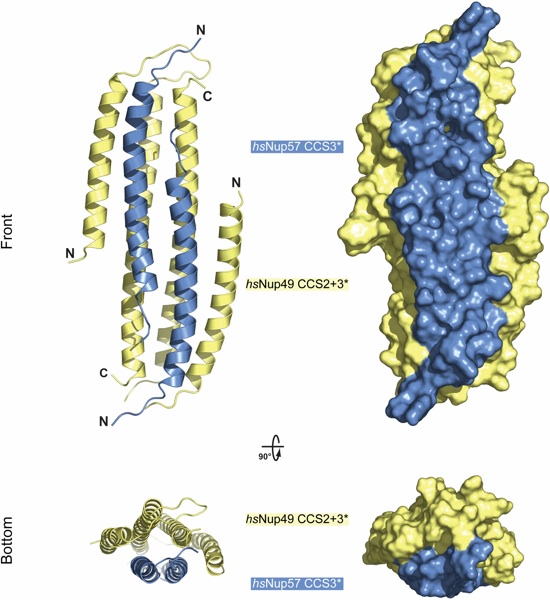
Fig. S24. Structure of hsNup49•Nup57 with 2:2 stoichiometry. Cartoon representation of the hsNup57CCS3*•hsNup49CCS2+3* hetero-dimer with 2:2 stoichiometry. Two orientations are shown from the front and side; hsNup57CCS3* (blue) and hsNup49CCS2+3* (yellow). A surface representation of the two views is shown on the right.

Fig. S25. Analysis of oligomeric state of human channel nup fragment mixtures. (A) Domain architectures of the H. sapiens Nup49 and Nup57 are shown and colored according to Figure S19. (B) SEC-MALS profiles of hsNup57CCS3* preincubated with increasing molar amounts of hsNup49 CCS2+3* (red, green, and blue). (C) SEC-MALS profiles of hsNup49CCS2+3* preincubated with increasing molar amounts of hsNup57CCS3* (yellow, red, green, and blue). Measured molecular masses are indicated for the peak fractions. Gray bars indicate fractions that were resolved on SDS-PAGE gels and visualized by Coomassie staining. An arrow indicates the position of a higher molecular mass peak, which was previously described as a Nup57CCS3*•Nup49CCS2+3* complex with 6:4 stoichiometry, which constitutes the keystone for the open ring structure in the “ring model” (71). The abundance of this peak increases with increasing amounts of hsNup49CCS2+3*, whereas it stays constant in the presence of increasing amounts of hsNup57CCS3*. The corresponding SDS-PAGE analysis shows that Nup49 is substantially more abundant in this peak. To rule out that differential staining of the two proteins causes a perceived excess of hsNup49CCS2+3*, hsNup49CCS2+3* was mixed with different molar amounts of hsNup57CCS3*, analyzed by SDS-PAGE and compared to the protein in the unknown peak (cyan). This analysis confirms an abundance of hsNup49CCS2+3* in the peak.

Fig. S26. Analysis of hsNup49CCS2+3* mutants that affect the formation of higher oligomeric states. (A) Domain architectures of the H. sapiens Nup49 and Nup57 are shown and colored according to Figure S19. A red dot indicates the position of the Y420F mutant in hsNup49, which was previously suggested to stabilize a hsNup57CCS3*•hsNup49CCS2+3* assembly with 6:4 stochiometry (71). (B) SEC-MALS profiles of wild type hsNup49CCS2+3* (blue) and hsNup49CCS2+3* Y420F (red) in isolation and (C) preincubated with equimolar amounts of hsNup57CCS3* (green and yellow; right). The Nup49CCS3* Y420F mutant decreases the height of the ~60 kDa peak (black arrow) in the presence of Nup57CCS3*, contrary to a previous report (71). SEC-MALS profiles of (D) hsNup49CCS2+3* Y420F and (E) hsNup49CCS2+3* ΔC417 at increasing protein concentrations. As reference, the wild type hsNup49CCS2+3* SEC profile at a protein concentration of 18 mg/ml is shown (black). Measured molecular masses are indicated for the peak fractions. Gray bars indicate fractions that were resolved on SDS-PAGE gels and visualized by Coomassie staining. (F) Close-up view of the elongated hetero-tetramer interface of hsNup49CCS2+3* in cartoon representation. The C-terminal two helical turns that are absent in the hsNup49CCS2+3* ΔC417 mutant are colored in red. The hsNup49CCS2+3* Y420F mutant forms higher order homo-oligomers with increasing molecular masses which is abolished in the hsNup49CCS2+3* ΔC417 mutant.

Fig. S27. Probing the CNT accessibility and assembly state in the IRC with synthetic monobodies. (A) Sequence alignment of the variable loops (BC, DE, FG) of 10 monobodies generated against either the CNT or the CNT•Nic96R1 complex. White bars indicate gaps in the alignment between loops. Single residue similarity is shaded from white (less than 40 % similarity), to yellow (40 % similarity), to red (100 % identity) using the BLOSUM62 matrix. (B) The dissociation constant of each monobody for CNT binding is shown. (C) The monobody scaffold is shown in cartoon representation highlighting the variable DE (blue), BC (yellow) and FG (magenta) loops. (D) A pairwise protein interaction matrix indicating competitive (blue) and non-competitive (green) binding to the CNT for the tested monobodies as determined by SEC-MALS analysis. (E) The monobodies are grouped according to their competitive CNT binding properties, indicating two distinct binding sites. (F) SEC-MALS profiles of CNT•SUMO-Nic96R1 (blue), CNT•SUMO-Nic96R1 bound to a single monobody (SUMO-MB6; red), and bound to 2 monobodies (SUMO-MB6 and SUMO-MB9; yellow) are shown. (G) SEC-MALS profiles of CNT•Nic96•SUMO-MB6•SUMO-MB9 (blue), Nup192•Nup145N (red), and after their preincubation (green) are shown. Measured molecular masses are indicated for the peak fractions. Gray bars indicate fractions that were resolved on SDS-PAGE gels and visualized by Coomassie staining. MALS and SDS-PAGE confirm the presence of the two monobodies MB6 and MB10 in the peak fractions of the IRC, confirming the steric accessibility of the CNT for monobody binding in solution.

Fig. S28. Probing the CNT accessibility and assembly state in the IRC with synthetic antibodies. (A) SEC-MALS profiles of the CNT (blue), the CNT preincubated with sAB-158 (red) and the CNT preincubated with sAB-158 and sAB-160 (green) are shown. (B) SEC-MALS profiles of the CNT•sAB-158 (blue), the Nup192TAIL•SUMO-Nic96R1R2 (red) and after their preincubation (green) are shown. (C) SEC-MALS profile of Nup192•Nic96•Nup145N•CNT•sAB-158 (blue). Measured molecular masses are indicated for the peak fractions. Gray bars indicate fractions that were resolved on SDS-PAGE gels and visualized by Coomassie staining. MALS and SDS-PAGE confirm stoichiometric complexes and the presence of sAb-158 in the peak fractions of the minimal and intact IRC, indicating the accessibility of the CNT for synthetic antibody binding and confirming that the CNT adopts the same assembly state in the IRC as observed in the crystal structure.
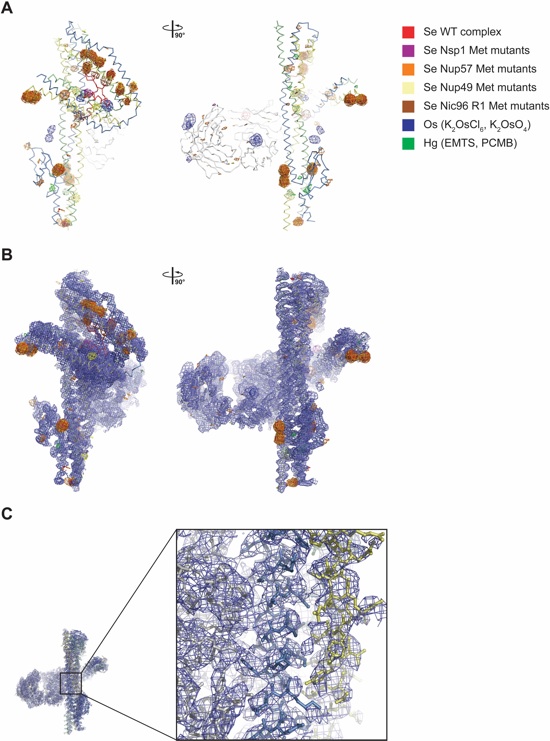
Fig. S29. Experimental phasing of the CNT•Nic96R1•sAB-158 structure. (A) Anomalous difference Fourier maps were calculated from X-ray diffraction data collected at the selenium, osmium and mercury peak wavelengths. A ribbon representation of the structure of the CNT•Nic96R1•sAB-158 complex with the indicated anomalous difference Fourier maps contoured at 3.5 σ is shown. The 29 introduced methionine mutants in Nsp1, Nup49, Nup57, and Nic96R1 yielded additional 22 selenium sites, validating the sequence register. (B) Experimental electron density map after density modification of the CNT•Nic96R1•sAB-158 complex phased with the anomalous signal from crystals soaked with potassium hexachloroosmate (K2OsCl6), contoured at 1.0 σ. The anomalous difference Fourier maps of the various heavy metal derivatives (panel A) are overlaid and contoured at 3.5 σ. (C) Close-up view of a representative section of the experimental electron density map from panel B overlaid with a stick representation of the final model.
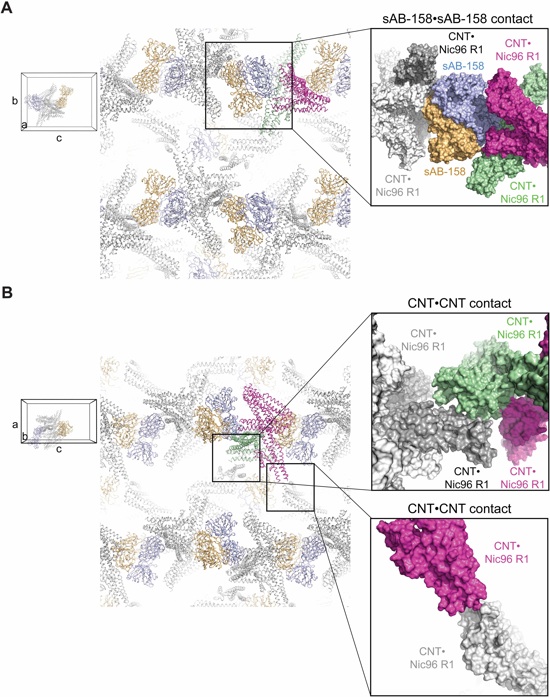
Fig. S30. Crystal packing interactions in the CNT•Nic96R1•sAB-158 crystals. (A, B) Crystal packing interactions in the CNT•Nic96R1•sAB-158 crystal shown in two different orientations. Each asymmetric unit is composed of two CNT•Nic96R1•sAB-158 complexes that dimerize in a cross-handshake fashion. The major crystal contact is formed by an interaction between sAB-158 molecules (blue and orange) from adjacent asymmetric units along the c axis. Two additional minor crystal contacts are formed by CNT-CNT interactions along the a and b axes. CNT•Nic96R1 complexes of one asymmetric unit are colored in green and magenta and their symmetry mates in light and dark gray. As references, units cell diagrams are shown to indicate the orientation of each view. The Insets mark the locations of the three crystal contact regions that are enlarged and shown in surface representation.

Fig. S31. Multispecies sequence alignment of the CNT coiled-coil segments. Sequences of the three coiled-coil segments of (A) Nup57, (B) Nsp1 and (C) Nup49 from C. thermophilum, S. cerevisiae, and H. sapiens were aligned based on the secondary structure elements observed in the CNT•Nic96R1 structure and colored by sequence similarity according to the BLOSUM62 (Blocks Substitution Matrix) matrix from white (less than 40 % similarity), to yellow (40 % similarity), to red (100 % identity). The numbering is according to the C. thermophilum channel nups. The secondary structure is indicated above the sequence as rectangles (α-helices), arrows (β-strands), and lines (unstructured regions). Gray dots indicate residues with no observed electron density in the crystal structure, which are presumed disordered. Secondary structure elements are colored according to Figure 4A with the exception of the Nup57 α/β domain (magenta). A yellow dot in the secondary structure plot of Nup57 (A) indicates the position of Q473 and Y293, which are used as positional markers in the structural comparison of Nup57CCS3* and hsNup57CCS3* (Figure S23E). Residues of the EVPIP mutant are indicated by red dots in the secondary structure plot of Nup49 (panel C). A black dot and a black bar indicate the position of the Y420F mutant and the residues removed in the ΔC417 mutant of hsNup49CCS2+3*, which increases the abundance (Figure S26, A to C) and abolishes the formation (Figure S26, D and E) of higher homo-oligomeric states, respectively.
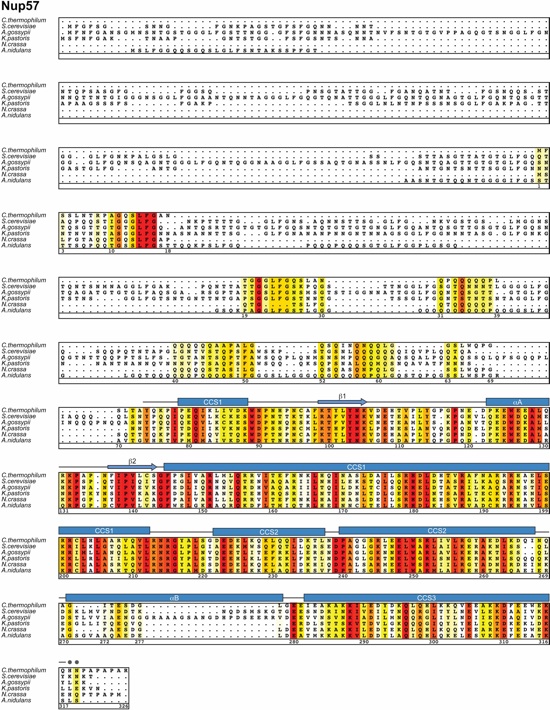
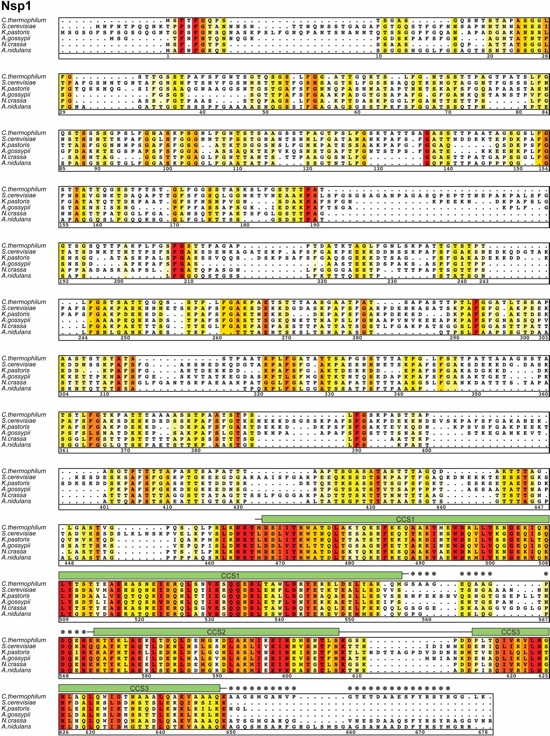
Fig. S32. Multispecies sequence alignment of full-length Nup57. Sequences from six diverse fungal species were aligned and colored by sequence similarity according to the BLOSUM62 matrix from white (less than 40 % similarity), to yellow (40 % similarity), to red (100 % identity). The numbering is according to C. thermophilum proteins. The secondary structure is indicated above the sequence as rectangles (α-helices), arrows (β-strands), and lines (unstructured regions). Gray dots indicate residues with no observed electron density in the crystal structure, which are presumed disordered. Secondary structure elements of Nup57 are colored according to Figure 4.
Fig. S33. Multispecies sequence alignment of full-length Nsp1. Sequences from six species were aligned and colored by sequence similarity according to the BLOSUM62 matrix from white (less than 40 % similarity), to yellow (40 % similarity), to red (100 % identity). The numbering is according to C. thermophilum proteins. The secondary structure is indicated above the sequence as rectangles (α-helices), arrows (β-strands), and lines (unstructured regions). Gray dots indicate residues with no observed electron density in the crystal structure, which are presumed disordered. Secondary structure elements of Nsp1 are colored according to Figure 4.
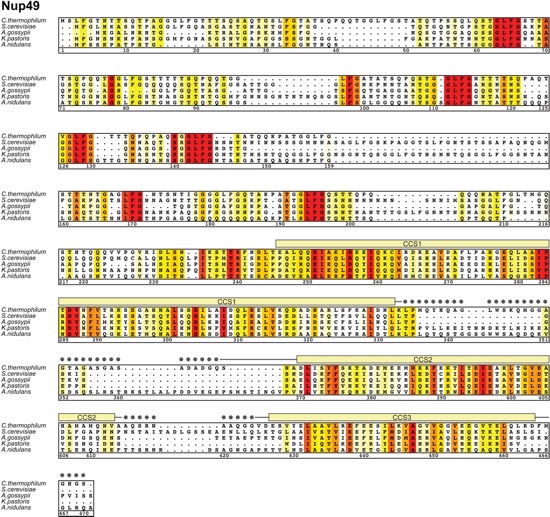
Fig. S34. Multispecies sequence alignment of full-length Nup49. Sequences from six diverse fungal species were aligned and colored by sequence similarity according to the BLOSUM62 matrix from white (less than 40 % similarity), to yellow (40 % similarity), to red (100 % identity). The numbering is according to C. thermophilum proteins. The secondary structure is indicated above the sequence as rectangles (α-helices), arrows (β-strands), and lines (unstructured regions). Gray dots indicate residues with no observed electron density in the crystal structure, which are presumed disordered. Secondary structure elements of Nup49 are colored according to Figure 4.
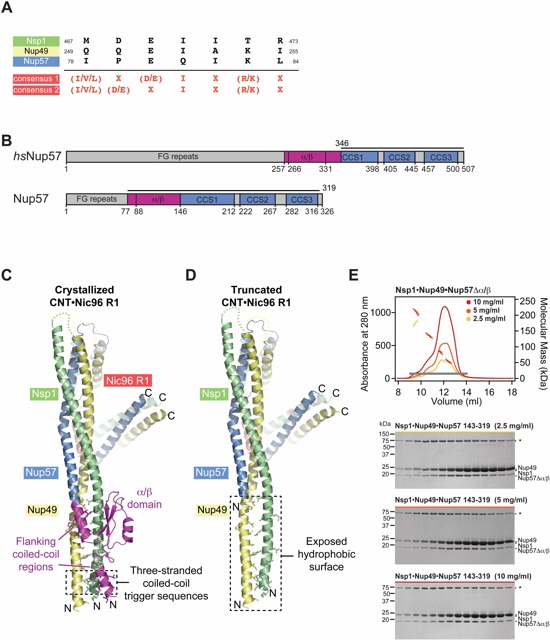
Fig. S35. Removal of the Nup57 α/β insertion domain results in non-stoichiometric higher-order CNT oligomers. (A) Alignment of the putative three-stranded coiled-coil trigger sequences of Nsp1 (green), Nup49 (yellow) and Nup57 (blue) is shown. The consensus sequence is depicted in red (X, any residue) (72). (B) Domain structures of H. sapiens and C. thermophilum Nup57. Bars above the domain structures indicate the domain boundaries of intact Nup57 as observed in the CNT•Nic96R1•sAB-158 crystal structure and of rnNup57 and hsNup57 fragments that were reported previously to form various vastly different CNT oligomerization states in solution (69, 71, 73, 74). (C) CNT•Nic96R1•sAB-158 structure is shown in cartoon representation colored according to Figure 4. The Nup57 α/β insertion domain and flanking coiled-coil regions that were excluded in previous mammalian CNT reconstitutions are colored in magenta. Hydrophobic residues in the coiled-coil center are represented in ball-and-stick representation. The location of the putative three-stranded coiled-coil trigger sequences is highlighted on the bottom. For clarity, sAB-158 was removed from the illustration. (D) Model of the CNT lacking an N-terminal Nup57 region that encodes the α/β insertion domain and flanking coiled-coil regions, corresponding to the mammalian Nup57 fragments used in previous studies. (E) SEC-MALS profiles of a C. thermophilum CNT variant using a Nup57 fragment that lacks the N-terminal coiled-coil region and the α/β insertion domain (residues 146-319) at three different concentrations. Measured molecular masses are indicated for the peak fractions. Gray bar indicates fractions that were resolved on SDS-PAGE gels and visualized by Coomassie staining. Asterisks indicate degradation products or contaminations. MALS and SDS-PAGE analysis establish that the removal of the Nup57 α/β insertion domain results in a CNT that adopts various different oligomeric states in solution, as previously observed for the mammalian truncated CNT (69, 71, 73, 74).
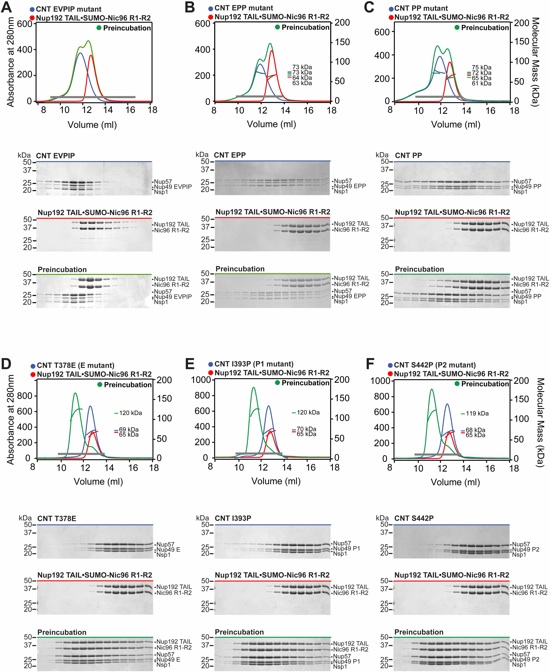
Fig. S36. Identification of CNT mutations that disrupt binding to the IRC. (A-F) SEC-MALS and SDS-PAGE analysis corresponding to Figure 5. SEC-MALS profiles of mutant CNT or Nup192TAIL•SUMO-Nic96R1-R2 complexes are shown individually (blue and red) and after their preincubation (green). Measured molecular masses are indicated for the peak fractions. Gray bars indicate fractions that were resolved on SDS-PAGE gels and visualized by Coomassie staining.

Fig. S37. Nup49 PP and EVPIP mutants decrease CNT thermostability. Wild type CNT and CNT carrying either the Nup49 PP or EVPIP mutant were incubated at the indicated temperatures for 30 minutes prior to centrifugation. Soluble (S) and pelleted (P) fractions were analyzed by SDS-PAGE and visualized by Coomassie staining. Red arrows indicate temperature increment at which in vitro aggregation ensued.

Fig. S38. The human NPC can accommodate the 60S pre-ribosomal particle. A top view of the cryoelectron tomography reconstruction of the human NPC is shown (EMD 2444; gray). The central transport channel is large enough to accommodate (A) the 60S pre-ribosomal particle (EMD 2528; blue) and (B) eleven Cse1•Kap-α•RanGTP nuclear export complexes (1WA5). (75-77).