Hoelz Lab: Publications
Figure 1. Structure of the Human DPF2 Tandem PHD Finger Domain. (A) Domain structure. Light gray, predicted unstructured regions (U); Blue, requiem domain (REQUIEM); dark gray, C2H2 zinc finger domain (C2H2); yellow, PHD finger 1 (PHD1); orange, PHD finger 2 (PHD2). The bar above the domain structure marks the crystallized fragment. (B) Structure of the DPF2 tandem PHD finger domain in ribbon representation, colored as in A. Zn2+ atoms are depicted as red (PHD1) and gray (PHD2) spheres. (C) Surface representation of DPF2PHD colored as in panel A (yellow, PHD1; orange, PHD2). (D) Surface representation of DPF2PHD colored according to a multispecies sequence alignment (Fig. S2). (E) Surface representation of DPF2PHD colored according to electrostatic potential. The electrostatic potential is plotted onto the surface and colored in a gradient from -10 kBT/e (red) to 10 kBT/e (blue).

Figure 2. Structural Comparison of the DPF2 and DPF3b Tandem PHD Finger Domains. (A) A ribbon representation of DPF2PHD (Left, colored as in Fig. 1A), DPF3bPHD•H3K14Ac (Center, colored in gray, PDB ID code 2KWJ), and a superposition of the two, based on alignment of PHD2s (Right). The hinge between PHD1 and PHD2 is indicated by an arrow. (B) Surface representations of the DPF3bPHD•H3K14Ac (Upper, PDB ID code 2KWJ) and the DPF3bPHD•H4K16Ac solution NMR structures (Lower, PDB ID code 2KWN). Boxes show a cartoon representation of the indicated binding sites superposed with our DPF2PHD crystal structure. Residues constituting the bipartite histone-recognition motif are shown in stick representation.
Figure 3. DPF2 Binds Histone Tails In Vitro and In Vivo. (A) Sequences and modifications of histone-tail peptides used in biochemical interaction studies. (B) Representative ITC data for interactions between an acetylated H3K14Ac (Left) and DPF2 wildtype (DPF2WT), and H3K14Ac and a DPF2 triple mutant (DPF2MUT; F275A, R300A and D346A) (Right) at 100 mM salt concentration. Upper parts of each box show raw data and Lower parts show integrated heat changes corrected for heat from dilution. (C) Representative ITC data for interactions between an acetylated H4K16Ac (Left) and DPF2WT, and H4K16Ac and DPF2MUT (Right) at 100 mM salt concentration. Upper parts of each box show raw data and Lower parts show integrated heat changes corrected for heat from dilution. (D) Immunofluorescence localization analysis of FLAG-DPF2. 293T cells were transfected with FLAG-DPF2 or FLAG-DPF2MUT and co-stained for anti-FLAG and DAPI to visualize nuclei. Top and bottom panels represent different cells from the same experiment. Scale bar is 10 μm. (E) Subcellular DPF2 localization analysis. Whole cell lysate (WCL), cytoplasmic (CY), nuclear (NU), and chromatin bound (CH) fractions of FLAG-DPF2 or FLAG-DPF2MUT transfected 293T cells were isolated and resolved by SDS-PAGE and probed for antibodies against FLAG and controls for each fraction. (F) In vivo analysis of the DPF2-histone interaction. 293T cells were transfected with FLAG-DPF2 or FLAG-DPF2MUT constructs followed by a 24-hour incubation with the HDAC inhibitor Vorinostat or DMSO. FLAG constructs were immunoprecipitated using anti-FLAG magnetic beads and lysates were probed for total histone H3 and H4. Input (10 %) is shown in the lower panel and probed with antibodies to total H3, total H4, and FLAG.
Figure 4. DPF2 Recruitment to Histones Inhibits Myeloid Differentiation. (A) Expression of DPF2 in a panel of acute leukemia cell lines compared to normal CD34+ cord blood cell control. DPF2 was detected with an anti-DPF2 antibody at a concentration of 1:1000 (sc-101943, Santa Cruz). (B) Overexpression of DPF2 wildtype (DPF2WT) or DPF2 triple mutant (DPF2MUT; F275A, R300A and D346A) protein in MOLM-13 cells as assessed by Western blot analysis. (C) Occupancy of the miR-223 promoter regions in MOLM-13 cells, overexpressing DPF2WT or DPF2MUT protein. Blue and yellow bars represent region 4 and region 5 of the miR-223 promoter region, respectively. Data represent the mean ± SD from three independent experiments. (D) Occupancy of a non-DPF2 responsive promoter (albumin) region in MOLM-13 cells, overexpressing DPF2WT or DPF2MUT protein. Data represent the mean ± SD from three independent experiments. (E) Schematic representation of the miR-223 promoter region. Two black lines represent the RUNX1 binding site on the miR-223 promoter region. (F) Overexpression of DPF2WT or DPF2MUT protein in human cord blood (CB) CD34+ cells as assessed by Western blot analysis. (G) DPF2MUT blocks the repressive effect of DPF2 on myeloid differentiation of HSPCs. CD34+ cells expressing DPF2WT, DPF2MUT or a vector control were cultured in myeloid differentiation-promoting cytokines for seven days. Myeloid differentiation was determined by FACS analysis for expression of CD11b. A representative experiment is shown. (H) Data represent the mean ± SD of percent CD11b-positive cells from three independent experiments. ∗p < 0.01 by Student’s t test.
Figure 5: Protein-Protein Interaction Network of DPF2 (A) Confirmation of SWI/SNF interacting proteins identified by the mass spectrometry analysis of proteins precipitated with endogenous DPF2. Whole cell lysates from Kasumi-1 cells were immunoprecipitated with DPF2-conjugated beads and interacting proteins were analyzed by Western blot. (B) Confirmation of SWI/SNF interacting proteins identified by the mass spectrometry analysis using FLAG-DPF2 constructs. Wildtype FLAG-DPF2 (DPF2WT) and FLAG-DPF2MUT proteins were immunopreciptated from 293T cells using anti-FLAG magnetic beads and analyzed by Western blot. (C) Overlapping DPF2 and RUNX1 interaction partners. Comparison of mass spectrometry analysis of the proteins interacting with endogenous DPF2 and proteins interacting with the dimethyl-Arg223-RUNX1 peptide. DPF2 interacting proteins are normalized to an IgG control and methyl-RUNX1 interacting proteins are normalized to a non-methylated peptide control. There were 22 protein interaction partners shared between the two datasets. (D) In vivo analysis of the DPF2-RUNX1 interaction. Co-immunoprecipitation of FLAG-RUNX1 with DPF2 and the isolated DPF2PHD domain. FLAG-RUNX1 and DPF2 or DPF2PHD were overexpressed in HEL cells by lentiviral transduction. Cells were lysed after 72 hours, immunoprecipitated with anti-FLAG magnetic beads and analyzed by Western blot. Input is 10 % of the nuclear extract.
PDB coordinates (link to PDB site) -
PDBCoordinates (*.pdb)
Structure Factors (.txt) -
Figures from the paper:
Coordinates:
Abstract:
Double plant homeodomain finger 2 (DPF2) is a highly evolutionarily conserved member of the d4 protein family that is ubiquitously expressed in human tissues and was recently shown to inhibit the myeloid differentiation of hematopoietic stem/progenitor and acute myelogenous leukemia cells. Here, we present the crystal structure of the tandem plant homeodomain finger domain of human DPF2 at 1.6-Å resolution. We show that DPF2 interacts with the acetylated tails of both histones 3 and 4 via bipartite binding pockets on the DPF2 surface. Blocking these interactions through targeted mutagenesis of DPF2 abolishes its recruitment to target chromatin regions as well as its ability to prevent myeloid differentiation in vivo. Our findings suggest that the histone binding of DPF2 plays an important regulatory role in the transcriptional program that drives myeloid differentiation.
California Institute of Technology
Division of Chemistry & Chemical Engineering
1200 E. California Blvd.
Pasadena, CA 91125-7200
© Copyright Hoelz Laboratory

Histone-binding of DPF2 mediates its repressive role in myloid differentiation

Figure 6. Model for the Inhibitory Role of DPF2 in Myeloid Differentiation. Histone-binding of DPF2 along with PRMT4 mediated methylation of RUNX1 residue Arg223 trigger the formation of a DPF2 containing repressive complex that is recruited to the miR-223 promoter. The interaction between DPF2 and methylated RUNX1 is either mediated by the DPF2 N-terminal region or bridged by components of a larger complex, such as the SWI/SNF chromatin remodeling complex. Formation of the repressive DPF2 containing RUNX1 complex on the miR-223 promoter region results in the repression of miR-223 transcription and a subsequent block of myeloid differentiation. As hematopoietic stem cells (HSCs) differentiate, the reduction in PRMT4 expression leads to disassembly and replacement of the repressive transcriptional complex by an activating complex that upregulates transcription of miR-223 among other genes.
Figure S3. Sequence alignment of human d4 family members. (A) The secondary structure is indicated above the sequence as blue cylinders (α helices), green arrows (β sheets), and grey lines (coil regions). The numbering below the alignment is relative to human DPF2. Overall sequence conservation at each position is shaded in a color gradient from white (below 40 % similarity) to yellow (60 % similarity) to dark red (100 % identity). Purple dots indicate residues mutated in our biochemical analysis, and gray dots indicate residues for which there was no observed electron density. (B) Surface representation of a model of DPF2PHD in complex with the indicated histones peptides based on the DPF3b solution structures (PDB ID codes 2KWJ, 2KWN). The model is colored according to the above multispecies sequence alignment.
Figure S4. Biochemical interaction analysis. (A) Sequences and modifications of peptides used in interaction experiments (B) Representative ITC data for interactions between wildtype DPF2 or a triple mutant (DPF2MUT; F275A, R300A and D346A) and H3 or H4 histone tail peptides at 100 mM NaCl concentration. Upper parts of each box show raw data and Lower parts show integrated heat changes corrected for heat from dilution. See also Table S4. (C) Representative ITC data for interactions between RUNX1 peptides and DPF2 at 0 mM NaCl concentration. Upper parts of each box show raw data and Lower parts show integrated heat changes corrected for heat from dilution.

Huber, F.M., # Greenblatt, S.M., # Davenport, A.M., # Martinez, C., Xu, Y., Vu, L.P., Nimer, S.D.,* Hoelz, A.*
(2017). Proc. Natl. Acad. Sci. USA, 114, 6016-6021
Figure S5. Circular dichroism spectroscopy. (A) Circular dichroism spectra of DPF2 wildtype (DPF2WT, blue) and a triple mutant (DPF2MUT, F275A, R300A and D346A, red). Spectra were measured in triplicate at a protein concentration of 0.25 mg/ml at 25 °C. (B) Size exclusion chromatography analysis of DPF2 wildtype (DPF2WT, blue) and a triple mutant (DPF2MUT, F275A, R300A and D346A, red).
Figure S6. RNA sequencing reveals a biological role for DPF2 in HSPCs. RNA sequencing of cord blood (CB) CD34+ cells expressing DPF2 directed or scrambled control shRNAs was performed 72 hours after lentiviral transduction. (A) DPF2 knockdown efficiency determined by relative DPF2 mRNA expression. (B) Functional annotation of RNA sequencing analysis by performing gene set enrichment analysis (GSEA). Representation GSEA plot is shown for data sets with a positive correlation with DPF2 knockdown. (C) Functional annotation of RNA sequencing analysis by performing gene set enrichment analysis (GSEA). Representation GSEA plot is shown for data sets with a negative correlation with DPF2 knockdown.
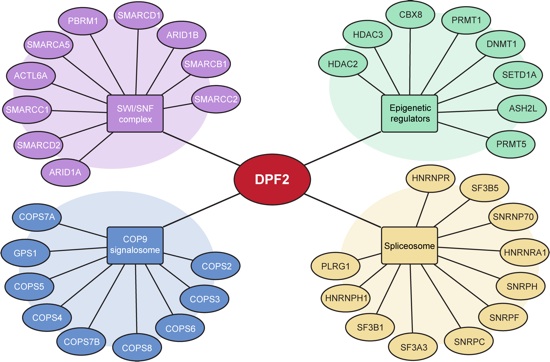
Figure S7. Schematic representation of the DPF2 interaction network. Endogenous DPF2 was immunoprecipitated from two leukemia cell lines and analyzed by mass spectrometry. Overlapping DPF2 interaction partners from both cell lines include components of the SWI/SNF complex, COP9 signalosome, spliceosomal complex, and epigenetic regulators.
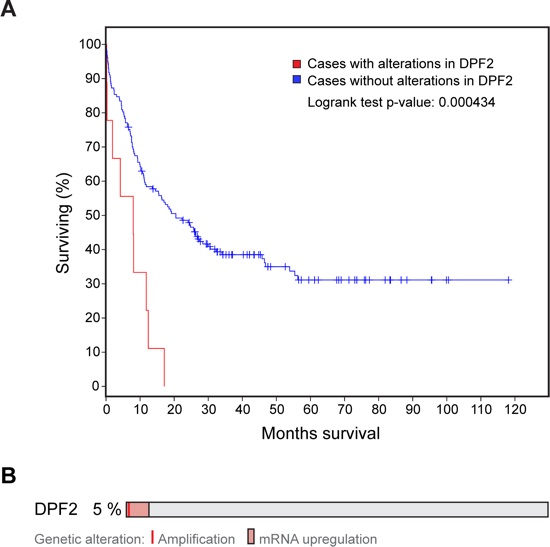
Figure S8. Analysis of the Cancer Genome Atlas database. (A) Overall AML patient survival rates are plotted for de novo AML cases without alterations in the DPF2 gene, represented by the blue line, compared to cases with alterations in the DPF2 gene, represented by the red line. (B) Schematic visualizes the 5 % of de novo AML patients that display alterations in DPF2. Patient data and graphs retrieved and adapted from the cBio Portal for cancer genomics.

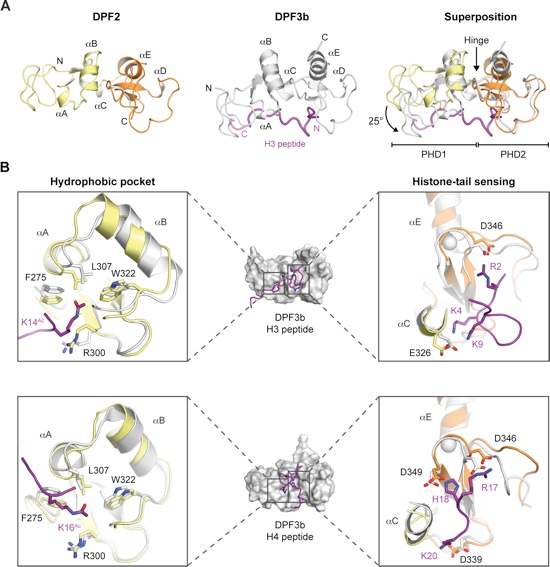


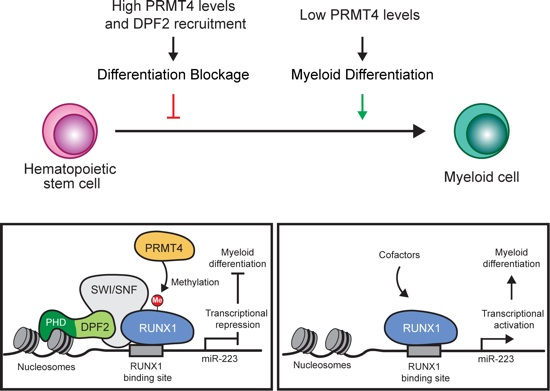
Figure S1. Structural analysis of human DPF2PHD. (A) Final 2|FO|-|FC| electron density map countered at 1.0 σ around a stick representation of the Zn2+ coordinating residues of DPF2PHD1 (Left) and DPF2PHD2 (Right). The Zn2+ atoms are shown as orange (PHD1) and gray (PHD2) spheres, respectively. (B) Superposition of DPF2PHD1 and DPF2PHD2, colored as in Fig. 1. (C) Superposition of the DPF2PHD1 and DPF2PHD2, colored as in Fig. 1, along with representative PHD domains (PDB ID codes 2KWJ, 2PUY, 3SOU, 4LK9, 4L7X, 4QF3), all colored in gray.

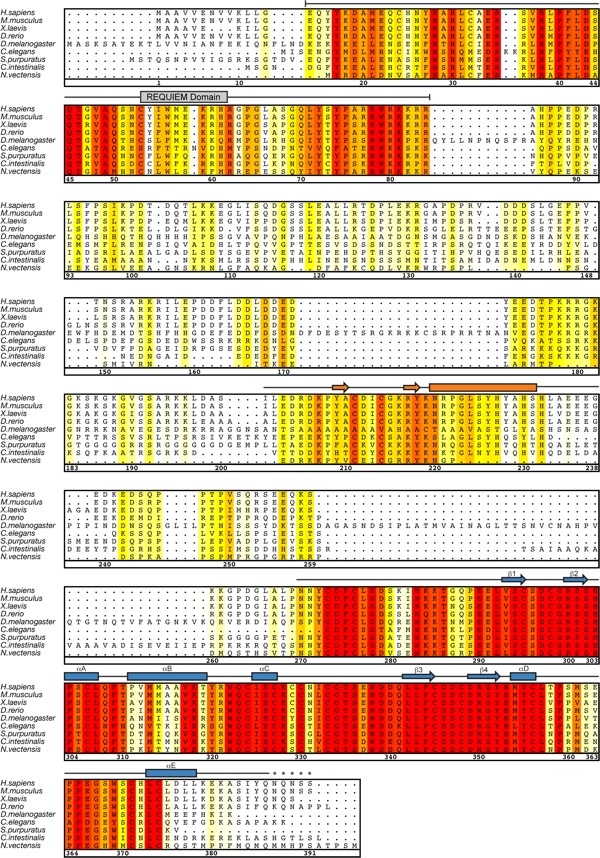
Figure S2. Multispecies sequence alignment of DPF2 homologues. The secondary structure is indicated above the sequence as cylinders (α helices), arrows (β sheets), and lines (coil regions). The numbering below the alignment is relative to human DPF2. Overall sequence conservation at each position is shaded in a color gradient from white (below 40 % identity) to yellow (60 % identity) to dark red (100 % identity). The secondary structure elements above the tandem PHD finger domain (residues 270 to 391) are as observed in the structure presented here and colored in blue, those above the C2H2 zinc finger domain (residues 206 to 232) are from the previously solved structure (PDB ID code 3IUF) and colored in orange.