Hoelz Lab: Publications
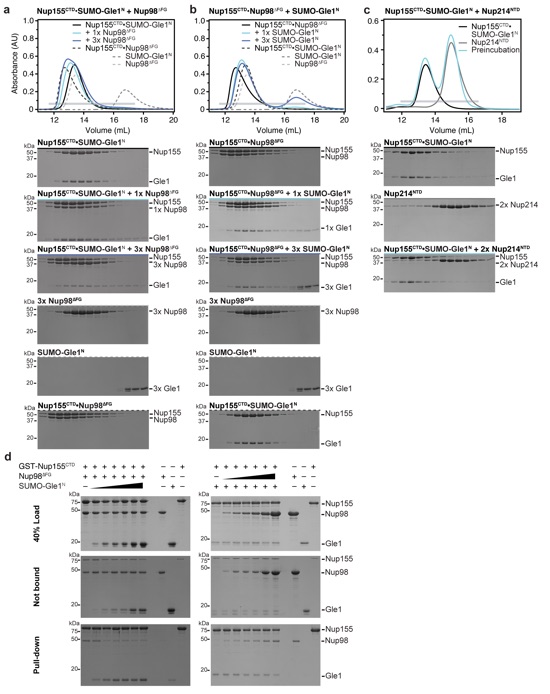
Figure 1. Gle1 is anchored to the nuclear pore complex through a competitive interaction with Nup98. a Cartoon schematic of the human nuclear pore complex (NPC). The circle highlights the region of the NPC to which the proteins used in this study localize. b Domain schematics for nucleoporins used in this study. Protein names and boundaries correspond to the human proteins. c Size exclusion chromatography (SEC) analysis of the interaction between Nup155CTD, SUMO-Gle1N, and Nup98ΔFG. Purified Nup155CTD•SUMO-Gle1N complex was mixed with the indicated amounts of Nup98ΔFG and loaded onto a Superdex 200 10/300 GL column. The gray bar indicates the fractions visualized with Coomassie-stained SDS-PAGE gels. d Left: table summarizing SEC analysis of Nup155CTD variants for Nup98ΔFG and SUMO-Gle1N binding. See also Supplementary Fig. 2. Right: the homologous positions were colored on the C. thermophilum Nup170•Nup145N structure (PDB ID 5HB0), indicating that the same binding surface is recognized by Nup98ΔFG and SUMO-Gle1N [2]. e Summary of the effect of Gle1N alanine substitution variants on Nup155CTD binding. Colored dots above the sequence of Gle1N indicate the effect of the substitution, green for wild-type levels of complex formation, orange for reduced binding, or red for complete disruption. See also Supplementary Fig. 2. f Identification of the Gle1 binding site suggests that the unassigned cytoplasmic density adjacent to bridging Nup155 molecules could contain Gle1 and its binding partners. Left: surface representation of the composite structure of the NPC2. Right: zoomed view of unassigned cytoplasmic density, with Nup155 shown in orange, Gle1N binding site colored in green, and coat nucleoporin complexes shown in yellow.

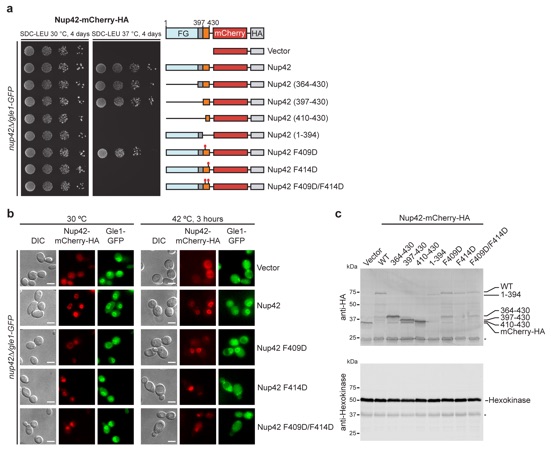
Figure 2. A conserved mechanism for Gle1•Nup42 complex formation. a In vivo localization analysis of Gle1-GFP and Nup42-mCherry-HA variants in nup42Δ/ gle1-GFP S. cerevisiae cells. Scale bar is 5 μm. Schematics on the right indicate the Nup42 fragments that were included in the construct, with omitted fragments indicated by replacement of the domain with a solid line. Residue numbers indicate the fragment included in each construct. See also Supplementary Fig. 3. b, c Differential scanning fluorimetry analysis of b S. cerevisiae or c H. sapiens Gle1CTD thermostability in the presence and absence of Nup42GBM and IP6. Exposure of hydrophobic residues was monitored by an increase in relative fluorescence units (RFUs). Curves represent the average of three experiments. See also Supplementary Fig. 4. d−f Crystal structures of d S. cerevisiae, e H. sapiens, or f C. thermophilum Gle1CTD•Nup42GBM. See also Supplementary Figs. 5 and 8–11. g Superposition of the structures of S. cerevisiae, H. sapiens, and C. thermophilum Gle1CTD•Nup42GBM, with same coloring as in d−f. See also Supplementary Movie 1. h−j Zoom views of h S. cerevisiae, i H. sapiens, or j C. thermophilum Gle1CTD•Nup42GBM interactions with residues mediating the interaction labeled.
Figure 3. Human Gle1CTD binding to DDX19 is IP6 independent. a−c Zoom view of the IP6 binding pocket of a S. cerevisiae, b C. thermophilum, or c H. sapiens Gle1CTD. Residues that are conserved in fungi but not metazoans are highlighted in red. See also Supplementary Figs. 7 and 12. d−f Surface electrostatic potential analysis of IP6 binding pockets for d S. cerevisiae, e C. thermophilum, or f H. sapiens Gle1. The same view as a−c is shown in surface representation colored by electrostatic potential, from red (−10 kBT/e) to white (0 kBT/e) to blue (+10 kBT/e), revealing a dramatically reduced electrostatic potential for human Gle1CTD. See also Supplementary Figs. 5, 10, and 11. g−i SEC analysis of the interaction between Dbp5/DDX19 and Gle1CTD•Nup42GBM for g S. cerevisiae, h C. thermophilum, or i H. sapiens, in the presence or absence of IP6. The elution profiles for Dbp5/DDX19 are shown in purple, Gle1CTD•Nup42GBM and IP6 are shown in gray, Gle1CTD•Nup42GBM without IP6 are shown in orange, Dbp5/DDX19 with Gle1CTD•Nup42GBM and IP6 are shown in light blue, and Dbp5/DDX19 with Gle1CTD•Nup42GBM without IP6 are shown in black. Fungal Gle1CTD•Nup42GBM interacts strongly with the Superdex matrix in the absence of IP6. The gray horizontal bar indicates fractions visualized with Coomassie-stained SDS-PAGE gels shown below.
Figure 4. Role of Nup42, RNA, and IP6 in Dbp5/DDX19 activation. a Steady-state colorimetric ATPase assay with S. cerevisiae Dbp5 performed at 30 and 37 ° C with either purified S. cerevisiae Gle1CTD or Gle1CTD•Nup42GBM. Reactions were performed with 0.5 μM Dbp5, 1.0 μM Gle1CTD or Gle1CTD•Nup42GBM, 0.1 mg/ml polyA RNA, and 2.0 μM IP6. Values shown are the average of three experiments. Error bars indicate the standard deviation. See also Supplementary Fig. 13. b Steady-state colorimetric ATPase assay with H. sapiens DDX19 performed at 30 and 37 °C with either purified H. sapiens Gle1CTD or Gle1CTD•Nup42GBM. Reactions were performed with 2.5 μM DDX19, 5.0 μM Gle1CTD or Gle1CTD•Nup42GBM, 0.1 mg/ml polyA RNA, and 10.0 μM IP6. Values shown are the average of three experiments. Error bars indicate the standard deviation. See also Supplementary Fig. 13. c RNA dependence of S. cerevisiae Dbp5 activation using the same conditions as in a, but with the indicated amounts of RNA performed at 30 and 37 °C. d RNA dependence of H. sapiens DDX19 activation using the same conditions as in b, but with the indicated amounts of RNA performed at 30 and 37 °C. e IP6 dependence of (left) S. cerevisiae Dbp5 or (right) H. sapiens DDX19 activation using the same conditions as in a or b, respectively, but with the indicated amounts of IP6
Figure 5. Structure of the human Gle1CTD•Nup42GBM•DDX19ΔN53 complex. a Crystal structure of H. sapiens Gle1CTD•Nup42GBM•DDX19ΔN53(ADP). Motifs of interest are colored and labeled: auto-inhibitory helix (residues 54–67, purple); mobile loop (residues 68–91, blue); trigger loop (residues 328–335, yellow); anchor loop (residues 390–403, cyan); motif VI (residues 429–435, light cyan); C-terminal helix (residues 468–479, magenta). Boxes indicate the regions shown to the right. b, c Close-up views of critical complex-forming interactions in interfaces 1 and 2. d Left: crystal structure of H. sapiens Gle1CTD•Nup42GBM•DDX19ΔN53(AMP-PNP•Mg2+). DDX19 is colored magenta for clarity. Right: Superposition of the ADP and AMP-PNP•Mg2+ bound structures. e Analysis of the effect of single amino acid substitutions in the Gle1-DDX19 interface on Gle1-mediated stimulation of DDX19, using the same conditions as in Fig. 4b at 37 °C. Values shown are the average of three experiments. Error bars indicate standard deviation. f Left: crystal structure of S. cerevisiae Gle1CTD•IP6•Dbp5ΔN90(ADP) (PDB ID 3RRN)10. Right: superposition of the S. cerevisiae and H. sapiens structures. The arrow indicates the rotation relating the conformations observed in the two crystal structures. Circles highlight structural differences. See also Supplementary Fig. 17.
Supplementary Figure 1: The interactions of Nup155CTD with Nup98∆FG or Gle1N are mutually exclusive. (a) Size exclusion chromatography analysis (SEC) of the interactions between Nup155CTD•SUMO-Gle1N and Nup98∆FG as in Figure 1c, but with additional control elution profiles. Purified Nup155•SUMO-Gle1N complex was mixed with the indicated amounts of Nup98∆FG and loaded on a Superdex 200 10/300 GL column. The gray horizontal bar indicates the fractions visualized with Coomassie-stained SDS-PAGE gels. (b) SEC of the interactions between Nup155CTD•Nup98∆FG and SUMO-Gle1N. Purified Nup155•Nup98∆FG complex was mixed with the indicated amounts of SUMO-Gle1N and loaded on a Superdex 200 10/300 GL column. Control elution profiles of Nup155•SUMO-Gle1N, Nup98∆FG and SUMO-Gle1N are included for reference. (c) Purified Nup155•SUMO-Gle1N complex was mixed with 2-fold molar excess Nup214NTD and loaded on a Superdex 200 10/300 GL column. No displacement is observed, demonstrating the specificity of the mutual exclusivity. (d) GST pull-down experiments with GST-Nup155CTD. Complexes of (left) GST-Nup155CTD•Nup98∆FG or (right) Nup155•SUMO-Gle1N were preformed with a molar ratio of 1:2 and incubated for 30 minutes. After preincubation, the preformed complexes were incubated for 30 minutes with increasing concentrations of (left) SUMO-Gle1N or (right) Nup98∆FG (molar ratios of 0.5, 1, 1.5, 2, 4, and 8). Samples were then pulled down with 25 μl of glutathione-coupled sepharose beads. Top gels contain the 40 % of the loaded sample, middle gels contain 40 % of the sample that was not pulled down, and bottom gels contain the glutathione-bound fractions.
Figures from the paper:
Abstract:
The nuclear pore complex (NPC) controls the passage of macromolecules between the nucleus and cytoplasm, but how the NPC directly participates in macromolecular transport remains poorly understood. In the final step of mRNA export, the DEAD-box helicase DDX19 is activated by the nucleoporins Gle1, Nup214, and Nup42 to remove Nxf1•Nxt1 from mRNAs. Here, we report crystal structures of Gle1•Nup42 from three organisms that reveal an evolutionarily conserved binding mode. Biochemical reconstitution of the DDX19 ATPase cycle establishes that human DDX19 activation does not require IP6, unlike its fungal homologs, and that Gle1 stability affects DDX19 activation. Mutations linked to motor neuron diseases cause decreased Gle1 thermostability, implicating nucleoporin misfolding as a disease determinant. Crystal structures of human Gle1•Nup42•DDX19 reveal the structural rearrangements in DDX19 from an auto-inhibited to an RNA-binding competent state. Together, our results provide the foundation for further mechanistic analyses of mRNA export in humans.
Figure 6. Conformational changes in DDX19 induced by Gle1 binding. a Left: crystal structure of H. sapiens DDX19ΔN53(ADP) (PDB ID 3EWS)44. Disordered regions (C-terminal helix and motif VI) are indicated with dashed lines. Middle: crystal structure of H. sapiens Gle1CTD•Nup42GBM•DDX19ΔN53(ADP) shown in the same orientation and colored as in Fig. 5a. Right: superposition of the two structures. Arrows indicate the rotation relating the conformations of DDX19ΔN53(ADP) in the presence and absence of Gle1CTD•Nup42GBM. The cartoon on the right schematizes the transition from the inhibited state to the Gle1-bound state. See also Supplementary Fig. 16. b Zoom view of the DDX19 trigger loop (yellow) in (left) the inhibited state (PDB ID 3EWS), (middle) the Gle1-bound state, and (right) their superposition. The cartoon on the right indicates the region of DDX19 shown. c Zoom view of the DDX19 anchor loop (cyan) and auto-inhibitory helix (purple) in the (left) inhibited state (PDB ID 3EWS), (middle) the Gle1-bound state, and (right) their superposition. The cartoon on the right indicates the region of DDX19 shown. d Zoom view of DDX19 Motif VI in (left) the inhibited state (PDB ID 3EWS), (middle) the Gle1-bound state, and (right) the RNA-bound state (PDB ID 3G0H)44. The cartoon on the right indicates the region of DDX19 shown.
Figure 7. Biochemical analysis of DDX19 activity. a Steady-state ATPase activity of DDX19 variants in the presence and absence of RNA and Gle1CTD•Nup42GBM. For schematics of the various truncation constructs, see Supplementary Fig. 18a. b Analysis of the effect of Nup214NTD on
DDX19 stimulation. See also Supplementary Fig. 18. c Analysis of concentration dependence of Nup214NTD on DDX19 stimulation in the presence of RNA and Gle1CTD•Nup42GBM. d Electrophoretic mobility shift assay analysis of the effect of Gle1CTD•Nup42GBM (1 μM) and Nup214NTD (2 μM) on DDX19 (1 μM) binding to a 53-nucleotide ssRNA. RNA was visualized by staining with SYBR gold. The proteins loaded in each lane were also visualized with a Coomassie-stained SDS-PAGE gel, shown below. e Mapping single amino acid substitutions associated with human diseases LCCS1/LAAHD and ALS onto the structure of Gle1CTD•Nup42GBM•DDX19ΔN53(ADP). Coloring is the same as in Fig. 5a. See also Supplementary Fig. 19. f Differential scanning fluorimetry analysis of the effect of human disease mutations on Gle1CTD•Nup42GBM stability. Exposure of hydrophobic residues monitored by an increase in relative fluorescence units (RFUs). Curves represent the average of three experiments. g Steady-state ATPase activity of DDX19 stimulation by Gle1CTD variants containing single amino acid substitutions associated with human disease. All reported values are the average of three experiments. Error bars indicate standard deviation.
Structural and Functional analysis of mRNA export regulation by the nuclear pore complex

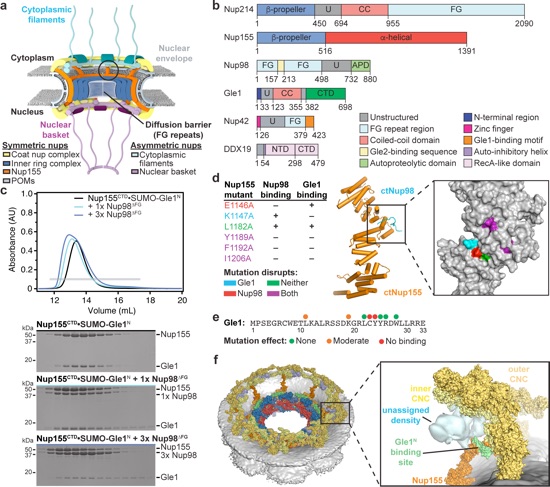
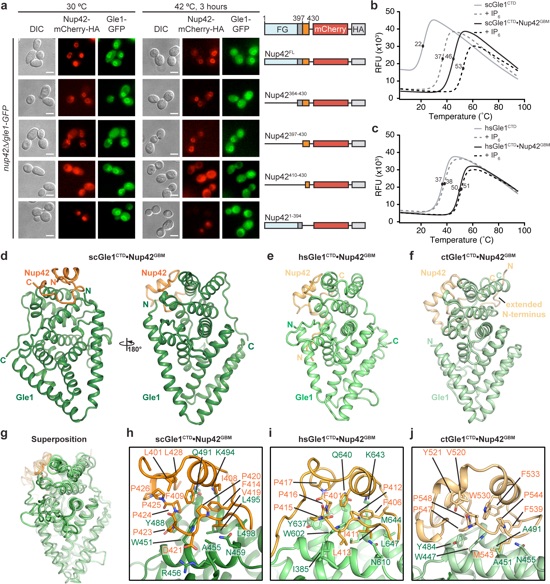
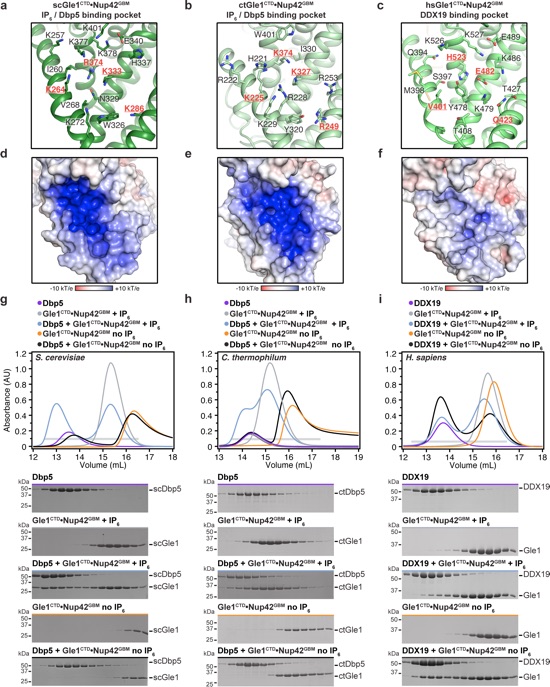
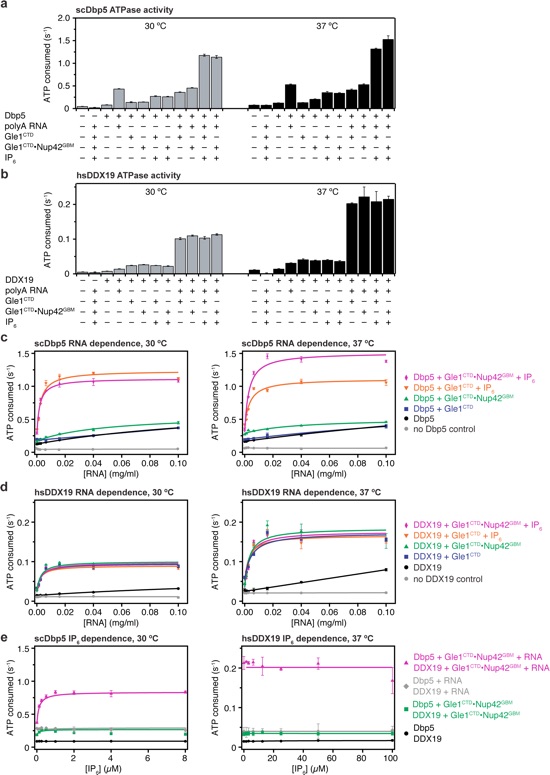
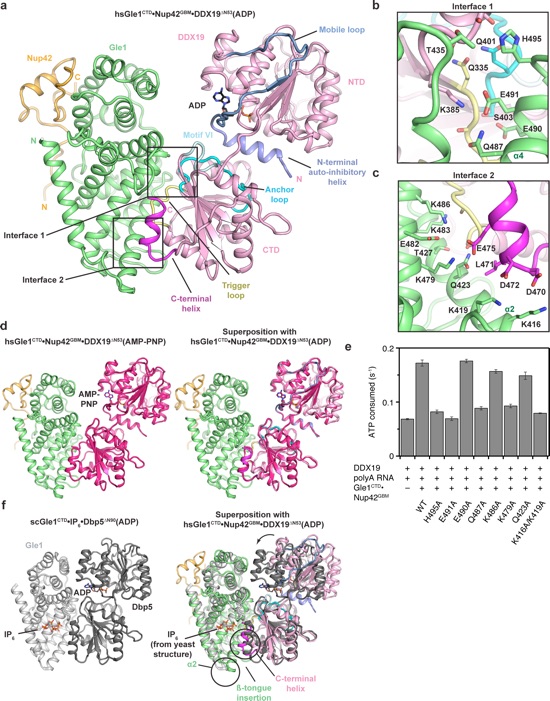
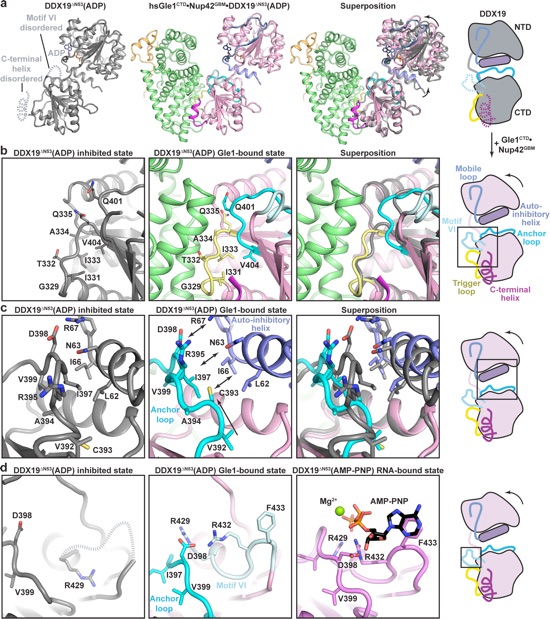
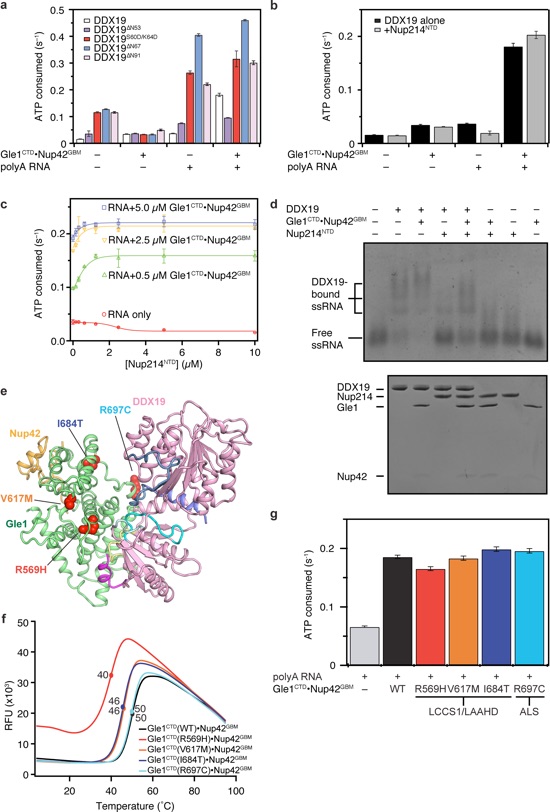
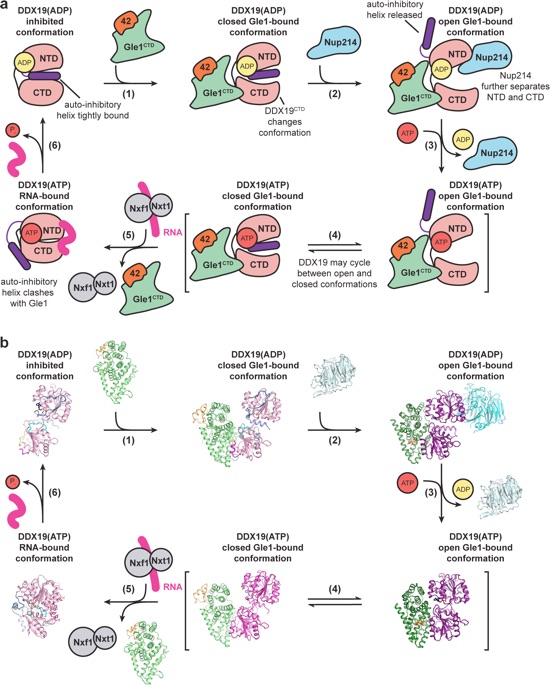
Figure 8. Proposed working model for the DDX19 catalytic cycle. a Schematic cartoon of the DDX19 catalytic cycle. b Schematic of the DDX19 catalytic cycle with crystal structures of each state. The inhibited conformation corresponds to the crystal structure of DDX19ΔN53(ADP) (PDB ID 3EWS)44. The closed Gle1-bound conformations correspond to the crystal structures of Gle1CTD•Nup42GBM•DDX19ΔN53(AMP-PNP•Mg2+) and Gle1CTD•Nup42GBM•DDX19ΔN53(ADP). The Gle1-bound open conformations correspond to the yeast Gle1CTD•IP6•Dbp5ΔN90(ADP) and Gle1CTD•IP6•Dbp5ΔN90(ADP)•Nup159NTD (PDB IDs 3RRM and 3RRN)10. The RNA bound conformation corresponds to the crystal structure of DDX19ΔN53(AMP-PNP•Mg2+)•U10 RNA (PDB IDs 3RRM and PDB ID 3G0H)44. Gle1CTD•Nup42GBM and Nup214NTD correspond to the apo structures (PDB ID 2OIT)69.
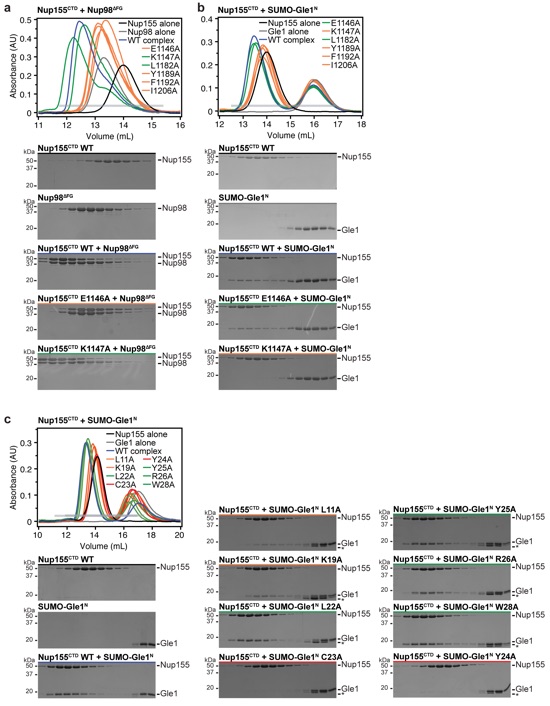
Supplementary Figure 2: Identification of residues involved in the interactions of Nup98∆FG and Gle1N with Nup155 binding. (a, b) SEC analysis of Nup155CTD mutants for Nup98∆FG and SUMO-Gle1N binding, respectively. Purified Nup155CTD mutants were preincubated with (a) Nup98∆FG or (b) SUMO-Gle1N and loaded on a Superdex 200 10/300 GL column. Control SEC profiles are shown for Nup155CTD (black), SUMO-Gle1N or Nup98∆FG (gray) and wild-type complex (blue). SEC profiles of Nup155CTD mutants preincubated with either SUMO-Gle1N or Nup98∆FG are colored green for wild-type levels of complex formation or orange for reduced binding. The gray horizontal bars in chromatograms indicate the fractions visualized with Coomassie-stained SDS-PAGE gels. (c) SEC analysis of the interactions between SUMO-Gle1N alanine mutants and Nup155CTD. Purified Nup155CTD was mixed with the indicated SUMO-Gle1N mutants and loaded on a Superdex 200 10/300 GL column. SEC profiles of Nup155CTD (black), SUMO-Gle1N (gray) and Nup155CTD preincubated with SUMO-Gle1N (blue) are shown as controls. SEC profiles of SUMO-Gle1N alanine mutants preincubated with Nup155CTD are colored green for wild-type levels of complex formation, orange for reduced binding, or red for complete disruption. Asterisks indicate degradation products of SUMO-Gle1N variants.
Supplementary Figure 3: Analysis of interaction between Nup42GBM and Gle1CTD in S. cerevisiae. (a) Growth analysis of S. cerevisiae nup42Δ/gle1-GFP strains containing the indicated Nup42-mCherry-HA variants. 10-fold serial dilutions were spotted onto SDC-LEU plates and grown for 4 days at 30 °C and 37 °C. Schematics on the right indicate the domain boundaries of the Nup42 variants. A solid line indicates omitted regions. (b) In vivo localization analysis in S. cerevisiae of Gle1-GFP and Nup42-mCherry-HA variants. Constructs are the same as in panel a. Scale bar is 5 μm. (c) Western blot analysis of the expression levels of Nup42-mCherry-HA variants in a S. cerevisiae nup42Δ/gle1-GFP strain. Nup42-mCherry-HA variants and the hexokinase loading control were detected with anti-HA and anti-hexokinase antibodies, respectively. Asterisks (*) indicate nonspecific bands detected by the antibodies.
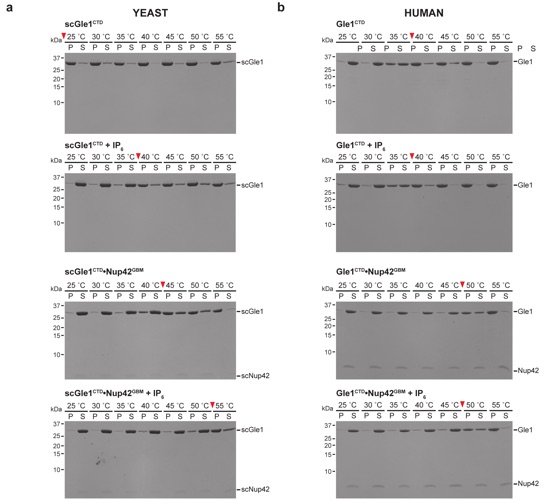
Supplementary Figure 4: Pelleting thermostability assay. (a) S. cerevisiae Gle1CTD or Gle1CTD•Nup42GBM was incubated at the indicated temperatures in the absence or presence of IP6 for 30 minutes prior to centrifugation. (b) H. sapiens Gle1CTD or Gle1CTD•Nup42GBM was incubated at the indicated temperatures in the absence or presence of IP6 for 30 minutes prior to centrifugation. Pelleted (P) and soluble (S) fractions were analyzed by SDS-PAGE and visualized by Coomassie staining. Red arrows indicate the temperature at which more than 50 % of total Gle1CTD pelleted.
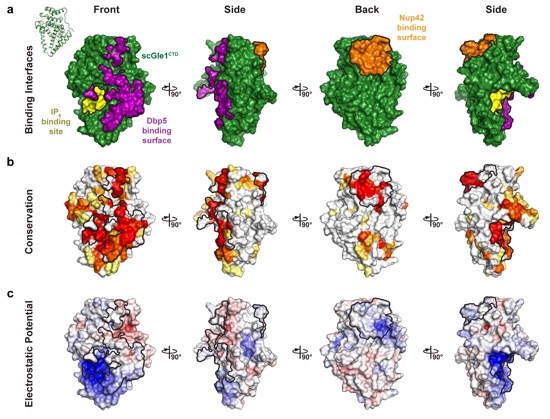
Supplementary Figure 5: Surface properties of S. cerevisiae Gle1CTD. Surface representations of Gle1CTD in four orientations related by 90° rotations. The Nup42GBM, IP6, and Dbp5 binding interfaces are outlined in black. (a) Identification of S. cerevisiae Gle1CTD binding surfaces. The IP6 binding site is colored in yellow, Dbp5 binding interface is colored in purple, and Nup42GBM interface is colored in orange. (b) Surface representation colored according to sequence conservation for fungi belonging to the Saccharomycotina and Schizosaccharomycetes groups using an alignment containing the species S. cerevisiae, Z. rouxii, K. lactis, C. albicans, Y. liplytica, T. deformans, S. complicata, and S. pombe. (c) Surface representation colored according to electrostatic potential from -10 kBT/e (red) to 0 kBT/e (white) to +10 kBT/e (blue).
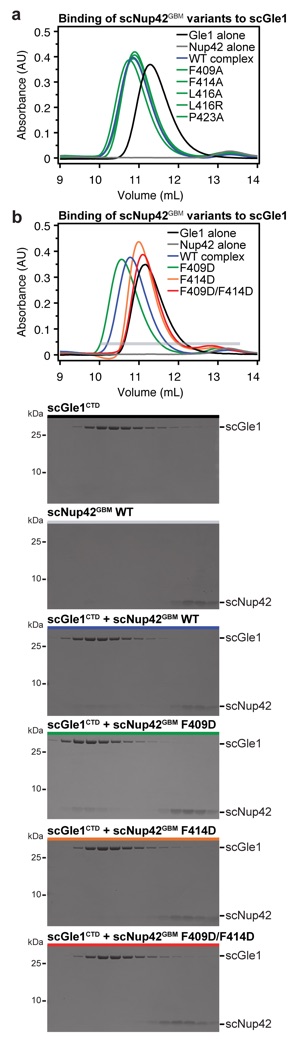
Supplementary Figure 6: Analysis of interaction between scNup42GBM and scGle1CTD. (a,b) SEC analysis of the effect of mutations in scNup42GBM on scGle1CTD binding. Purified scGle1CTD was mixed with the indicated scNup42GBM mutants and loaded on a Superdex 75 10/300 GL column. SEC profiles of scGle1CTD (black), scNup42GBM (gray), and scGle1CTD preincubated with scNup42GBM (blue) are shown as controls. SEC profiles of scNup42GBM mutants preincubated with scGle1CTD are colored green for wild-type levels of complex formation, orange for reduced binding, or red for complete disruption. The gray horizontal bar indicates the fractions visualized with Coomassie-stained SDS-PAGE gels.
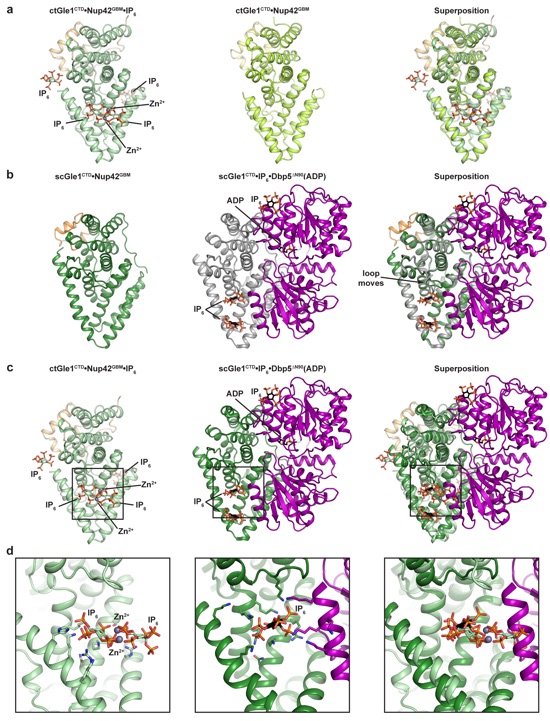
Supplementary Figure 7: Analysis of the effect of IP6 binding on Gle1CTD in fungi. (a) Comparison of the C. thermophilum Gle1CTD•Nup42GBM•IP6 and Gle1CTD•Nup42GBM structures. (b) Comparison of the S. cerevisiae Gle1CTD•Nup42GBM and S. cerevisiae Gle1CTD•IP6•Dbp5∆N90(ADP) (PDB ID 3RRN) structures3. (c) Comparison of the C. thermophilum Gle1CTD•Nup42GBM•IP6 and S. cerevisiae Gle1CTD•IP6•Dbp5∆N90(ADP) structures (PDB ID 3RRN). (d) Zoomed view of the IP6 binding pocket in the C. thermophilum Gle1CTD•Nup42GBM•IP6 and S. cerevisiae Gle1CTD•IP6•Dbp5∆N90(ADP) (PDB ID 3RRN) structures.
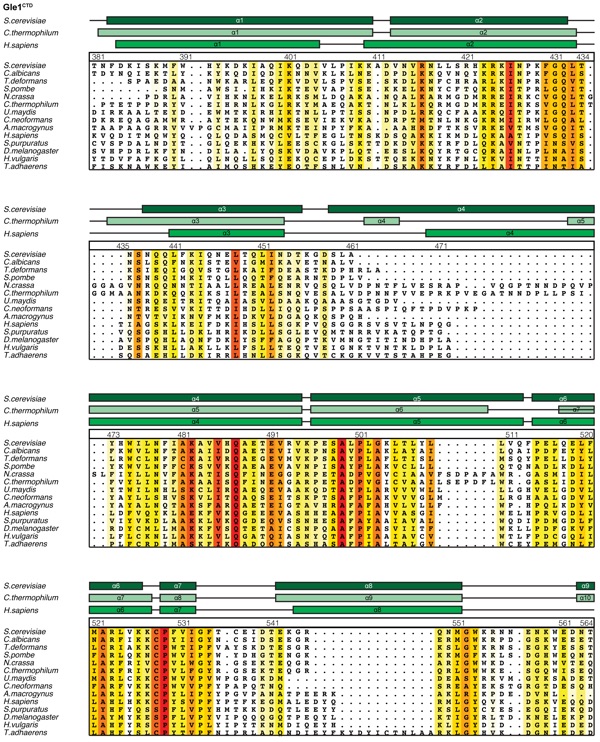
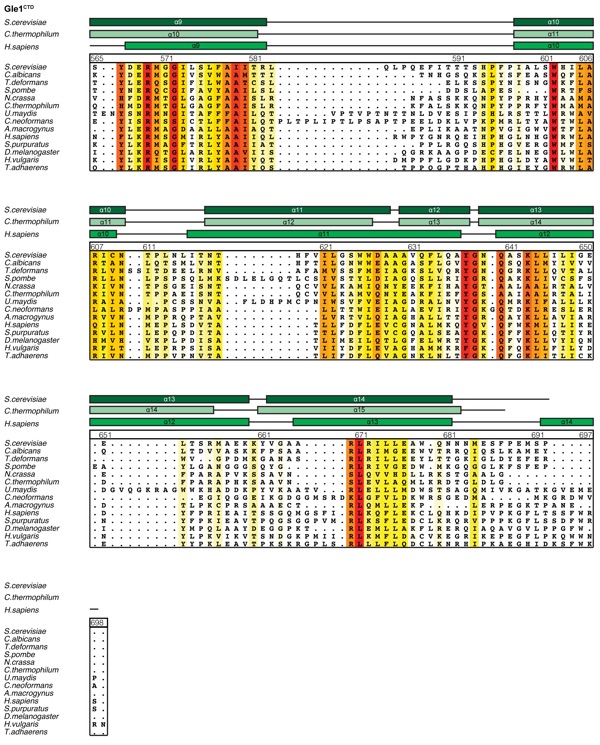
Supplementary Figure 8: Multispecies sequence alignment of Gle1CTD. Sequences from fourteen diverse species were aligned and colored by sequence similarity according to the BLOSUM62 matrix from white (less than 40 % similarity), to yellow (55 % similarity), to red (100 % identity). The numbering is according to the H. sapiens protein. The secondary structure is indicated above the sequences as rectangles (-helices) and lines (unstructured regions) for the S. cerevisiae, C. thermophilum, and H. sapiens proteins.
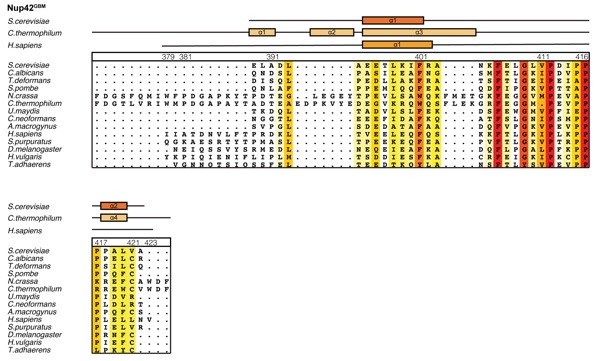
Supplementary Figure 9: Multispecies sequence alignment of Nup42GBM. Sequences from fourteen diverse species were aligned and colored by sequence similarity according to the BLOSUM62 matrix from white (less than 40 % similarity), to yellow (55 % similarity), to red (100 % identity). The numbering is according to the H. sapiens protein. The secondary structure is indicated above the sequences as rectangles (-helices) and lines (unstructured regions) for the S. cerevisiae, C. thermophilum, and H. sapiens proteins.
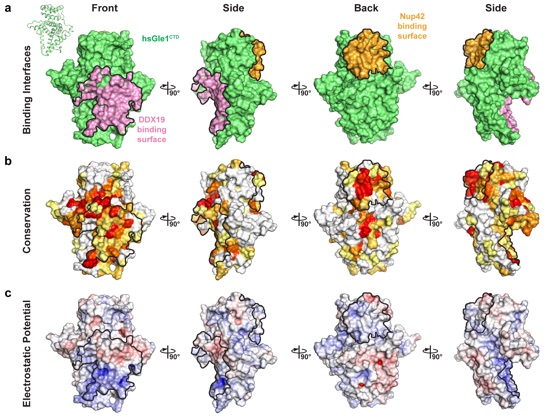
Supplementary Figure 10: Surface properties of H. sapiens Gle1CTD. Surface representations of Gle1CTD in four orientations related by 90° rotations. The Nup42GBM and DDX19 binding interfaces are outlined in black. (a) Identification of H. sapiens Gle1CTD binding surfaces. The DDX19 and Nup42GBM binding interfaces are colored pink and orange, respectively. (b) Surface representation colored according to sequence conservation for animals using an alignment containing the species H. sapiens, X. tropicalis, D. rerio, S. purpuratus, T. castaneum, D. melanogaster, C. teleta, H. vulgaris, A. digitifera, and T. adhaerens. (c) Surface representation colored according to electrostatic potential from -10 kBT/e (red) to 0 kBT/e (white) to +10 kBT/e (blue).
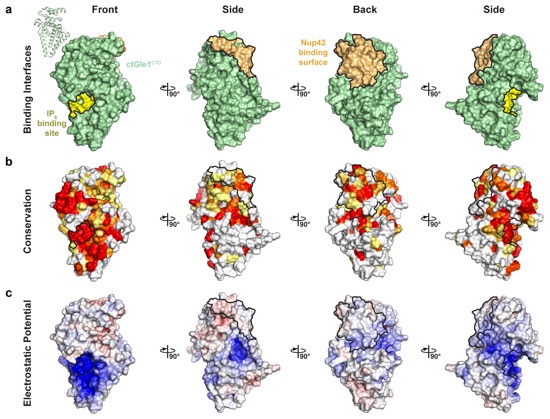
Supplementary Figure 11: Surface properties of C. thermophilum Gle1CTD. Surface representations of ctGle1CTD in four orientations related by 90° rotations. The ctNup42GBM and IP6 binding interfaces are outlined in black. (a) Identification of ctGle1CTD binding surfaces. The IP6 and ctNup42GBM binding sites are colored yellow and light orange, respectively. (b) Surface representation colored according to sequence conservation for fungi belonging to the Pezizomycotina subdivision using an alignment containing the species C. thermophilum, X. heveae, S. sclerotiorum, C. militaris, P. digitatum, and F. verticilliodes. (c) Surface representation colored according to electrostatic potential from -10 kBT/e (red) to 0 kBT/e (white) to +10 kBT/e (blue).
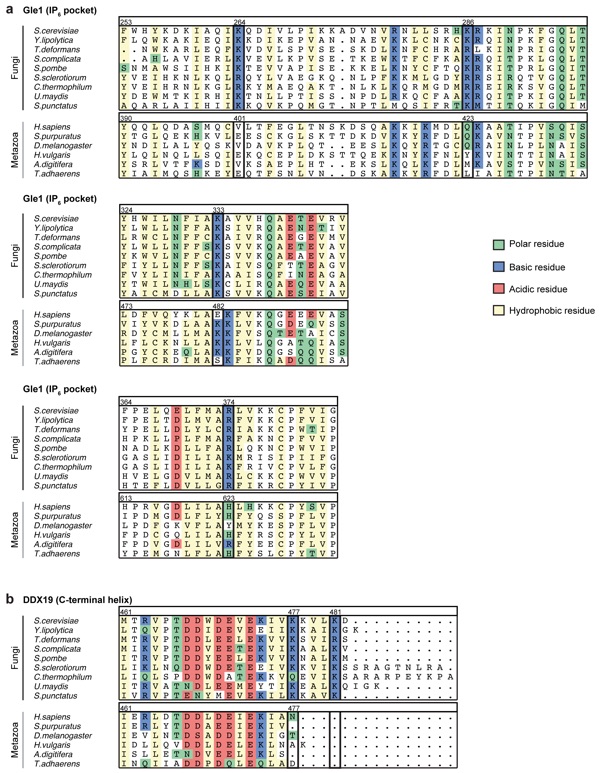
Supplementary Figure 12: Multispecies sequence alignment of the Gle1 IP6 pocket and the DDX19 C-terminal helix. Basic residues conserved in fungi are outlined with black boxes. Residues are colored according to an adapted Clustal color scheme.
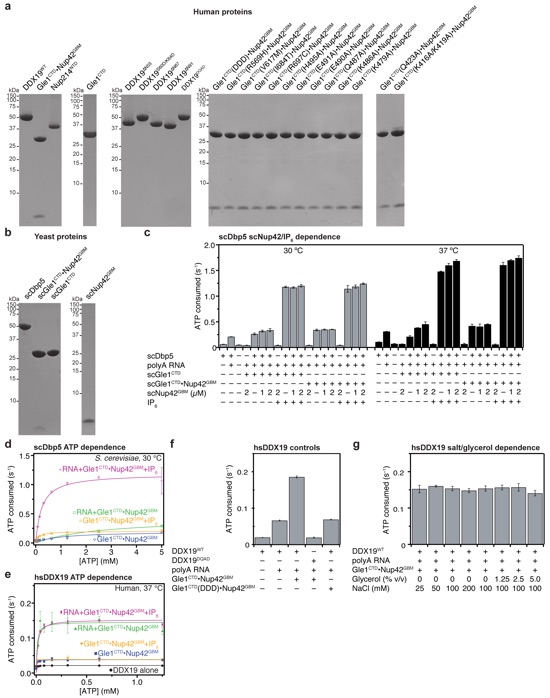
Supplementary Figure 13: Steady state colorimetric ATPase activity assay. (a, b) SDS-PAGE analysis of the purified (a) human and (b) yeast proteins used in activity assays. (c) Steady-state ATPase activity of scDbp5 with increasing amounts of scNup42GBM. Reactions were performed with 0.5 μM scDbp5, 1.0 μM scGle1CTD or scGle1CTD•Nup42GBM, and 2.0 μM IP6. (d) ATP dependence of scDbp5 activity. (e) ATP dependence of DDX19 activity. (f) Steady-state ATPase activity of a catalytically dead DDX19 mutant or a Gle1CTD mutant that abolishes stimulation of DDX19 by Gle1CTD, indicating that no activity can be attributed to contaminating factors. (f) Salt and glycerol concentration dependence of DDX19 activity. All reported values are the average of three experiments. Error bars represent standard deviation.
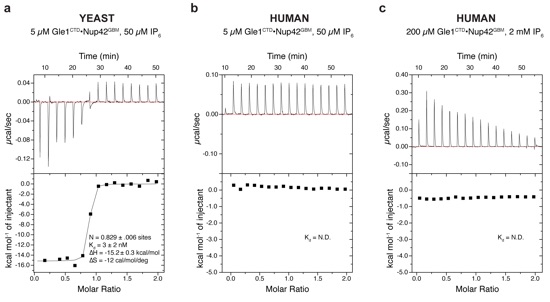
Supplementary Figure 14: Isothermal titration calorimetry analysis of IP6 binding. (a) Representative baseline-corrected ITC experiment for IP6 binding to S. cerevisiae Gle1CTD•Nup42GBM performed with 5 μM scGle1CTD•Nup42GBM in the cell and 50 μM IP6 at 21 °C. (b) Representative baseline-corrected ITC experiment IP6 binding to human Gle1CTD•Nup42GBM performed with identical conditions as (a). (c) Representative baseline-corrected ITC experiment for IP6 binding to human Gle1CTD•Nup42GBM performed with 200 μM Gle1CTD•Nup42GBM in the cell and 2.0 mM IP6 at 21 °C. All experiments were performed in triplicate. Baseline was corrected by subtracting heat release from a titration of the appropriate concentration of IP6 into only buffer. N.D. indicates that binding could not be detected and the binding parameters were not determined.
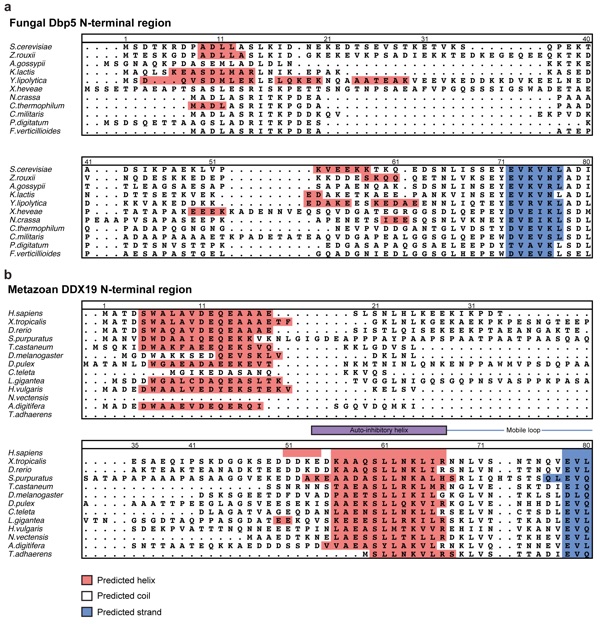
Supplementary Figure 15: Secondary structure predictions for the N-terminal regions of fungal Dbp5 and metazoan DDX19. Sequences of the unstructured N-terminal regions of (a) fungal Dbp5 or (b) metazoan DDX19 proteins are shown and colored by predicted secondary structure from PSIPRED6. Predicted helical residues are colored red, predicted strand residues are colored blue, and predicted coil residues are colored white. Numbering above fungal sequences corresponds to S. cerevisiae residues and numbering above metazoan sequences corresponds to the human residues.
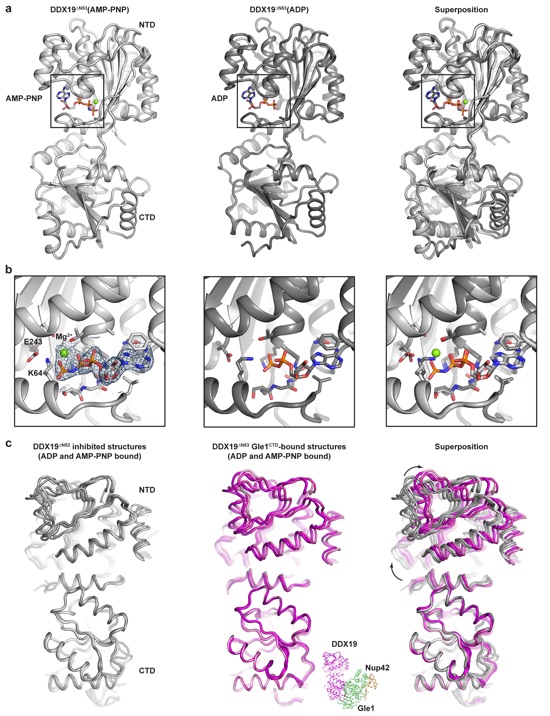
Supplementary Figure 16: Structure of DDX19∆N53(AMP-PNP•Mg2+) and analysis of DDX19 conformations. (a) Left: crystal structure of H. sapiens DDX19∆N53(AMP-PNP•Mg2+). Middle: crystal structure of H. sapiens DDX19∆N53(ADP) (PDB ID 3EWS)7. Right: superposition of the two structures. (b) Zoomed view of the nucleotide binding pockets of the structures in panel (a). The 2|Fo|-|Fc| electron density map around the AMP-PNP molecule is shown at a contour level of 1.0 . (c) Left: superposition of all four molecules from the asymmetric units of the DDX19∆N53(AMP-PNP•Mg2+) and DDX19∆N53(ADP) (PDB ID 3EWS) structures. Middle: superposition of all four molecules from the asymmetric units of the Gle1CTD•Nup42GBM•DDX19∆N53(AMP-PNP•Mg2+) and Gle1CTD•Nup42GBM•DDX19∆N53(ADP) structures. A cartoon of the heterotrimeric complex is shown at the bottom right to indicate the orientation of the molecule shown. Right: superposition of all structures. Arrows indicate the direction of movement from the inhibited to the Gle1-bound structures.

California Institute of Technology
Division of Chemistry & Chemical Engineering
1200 E. California Blvd.
Pasadena, CA 91125-7200
© Copyright Hoelz Laboratory
Coordinates:
PDB coordinates (link to PDB site)
PDBCoordinates (*.pdb)
Structure Factors (.txt)
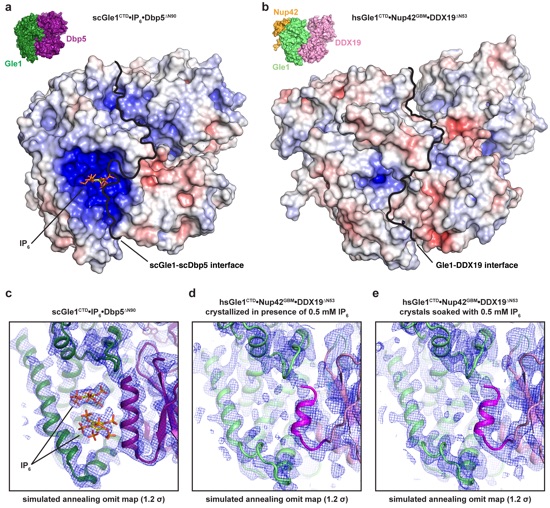
Supplementary Figure 17: Analysis of the IP6 binding pockets in the context of complex formation. (a) Surface view of the S. cerevisiae Gle1CTD•IP6•Dbp5∆N90(ADP) complex (PDB ID 3RRN) colored according to electrostatic potential from -10 kBT/e (red) to 0 kBT/e (white) to +10 kBT/e (blue)3. An IP6 molecule is shown in stick representation to indicate the positively charged IP6 binding pocket. The scGle1-scDbp5 interface is indicated by the black line. (b) Surface view of the human Gle1CTD•Nup42GBM•DDX19∆N53(AMP-PNP•Mg2+) complex colored according to electrostatic potential from -10 kBT/e (red) to +10 kBT/e (blue). The Gle1-Dbp5 interface is indicated by the black line. (c) A simulated annealing omit map calculated for the S. cerevisiae Gle1CTD•IP6•Dbp5∆N90(ADP) complex (PDB ID 3RRN) contoured at 1.2 . (d) A simulated annealing omit map calculated for human Gle1CTD•Nup42GBM•DDX19∆N53(AMP-PNP•Mg2+) grown in the presence of 0.5 mM IP6 contoured at 1.2 . (e) A simulated annealing omit map calculated for human Gle1CTD•Nup42GBM•DDX19∆N53(AMP-PNP•Mg2+) soaked with 0.5 mM IP6 contoured at 1.2 .
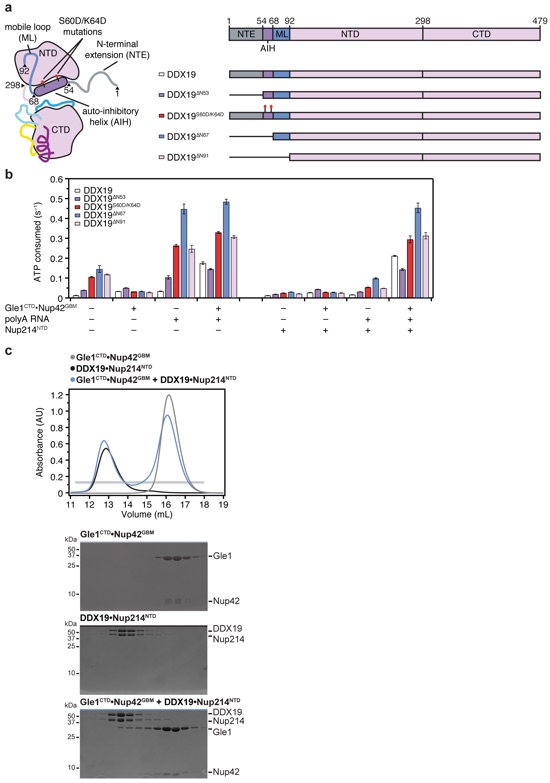
Supplementary Figure 18: Gle1CTD•Nup42GBM rescues DDX19 inhibition by Nup214NTD in the presence and absence of the auto-inhibitory helix. (a) Schematics of the construct boundaries of DDX19 variants used in steady-state ATPase assays. (b) Steady-state ATPase rates of DDX19 variants in the presence and absence of Nup214NTD. Values reported are the average of three experiments. Error bars represent standard deviation. (c) SEC analysis of the interaction between Gle1CTD•Nup42GBM and DDX19•Nup214NTD. 40 μM of purified Gle1CTD•Nup42GBM complex was mixed with 20 μM purified DDX19•Nup214NTD and loaded onto a Superdex 200 10/300 GL column. The gray bar indicates the fractions visualized with Coomassie-stained SDS-PAGE gels.
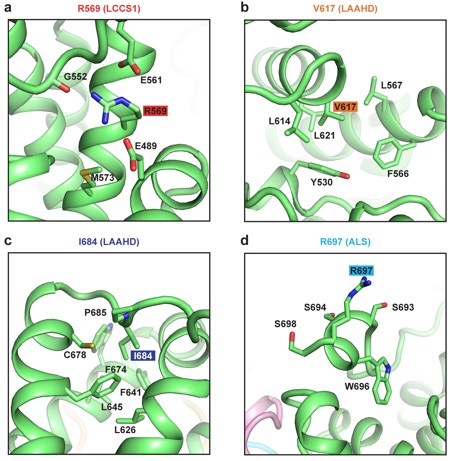
Supplementary Figure 19: Impact of Gle1 disease-related mutations. (a-d) Zoomed views of the Gle1 residues mutated in human disease.
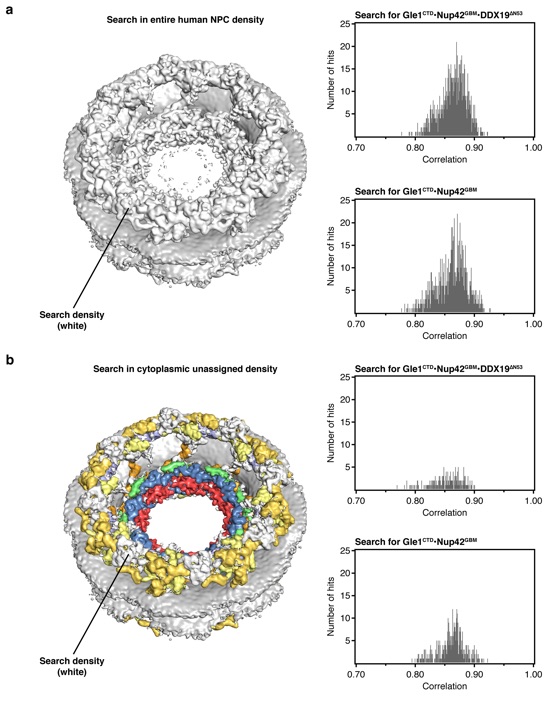
Supplementary Figure 20: Searches for human crystal structures in the cryoelectron tomographic reconstruction of the intact human NPC. (a) Left: the cryoelectron tomographic reconstruction of the human NPC is shown on the left, with the protein density colored white and nuclear envelope colored in gray. Searches were performed with 50,000 random positions within 100 Å of the cytoplasmic outer ring. Histograms on the right show the distribution of scores. (b) Right: the cryoelectron tomographic reconstruction of the human NPC is colored according to the assigned density in the composite structure of the NPC8. Searches were performed with 50,000 random positions within 100 Å of the cytoplasmic outer ring into the remaining cytoplasmic density, colored in white. Histograms on the right show the distribution of scores.
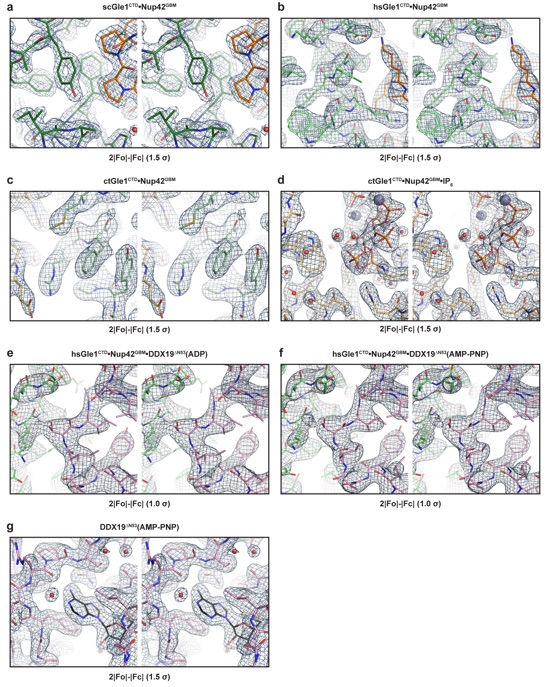
Supplementary Figure 21: Representative stereo views of electron densities for reported structures. (a-g) Cross-eyed stereo views for each of the reported structures. All maps are 2|Fo|-|Fc| maps contoured at the threshold values indicated below each stereo view.
Lin, D.H., Correia, A.R., Cai, S.W., Huber, F.M., Jette, C.A., Hoelz, A.*
(2018). Nat. Commun. 2319.