Hoelz Lab: Publications
Figure 1. Overall architecture of the CNC. (A) Domain structures of the yeast coat nups and sAB-57. Black lines indicate the crystallized fragments. U: unstructured, D: domain invasion motif, VH: heavy chain variable region, CH: heavy chain constant region, VL: light chain variable region, CL: light chain constant region. (B) Reconstitution of the yeast CNC•sAB-57, lacking Nup133. Elution profiles from a Superdex 200 10/300 column are shown for Nup120•Seh1•Nup85 (Trimer 1), Sec13•Nup145C•Nup84NTD (Trimer 2), CNC, and CNC•sAB-57 (left). SDS-PAGE gel of the reconstituted CNC•sAB-57 used for crystallization (right). (C) Cartoon and schematic representations of the yeast CNC•sAB-57 crystal structure viewed from two sides.

Figure 2. Architecture of the CNC triskelion. Cartoon representation of the triskelion formed by Nup120, Nup85 and Nup145C. Insets (A-C) depict magnified views for the interactions between (A) Nup120CTD, Nup85CTD, and Nup145CCTD (B) Nup120CTD, Nup85CTD, and N-terminal Nup145C helix; and (C) Nup145C, Nup85CTD, and sAB-57. The density modified electron density map is contoured at 1.0 σ.
Figure 3. Comparison of yeast and human CNCs. (A) Fit of the yeast CNC crystal structure into the human CNC negative-stain EM reconstruction (gray) (3). Arrows indicate density accounted for by the additional human coat nups Nup37 or Nup43. (B) Comparison of the quality of fit for the yeast CNC crystal structure and human CNC EM reconstruction (cyan) into the intact human NPC cryoelectron tomographic reconstruction (gray) (3). Arrows indicate regions where the human CNC EM reconstruction protrudes from the cryoelectron tomographic reconstruction.
Figure 4. Architecture of the NPC coat. (A) 32 copies of the yeast CNC, shown in cartoon representation with a representative subunit colored as in Fig. 1, docked into the cryoelectron tomographic reconstruction of the intact human NPC (3), shown as a gray surface. The outer and inner cytoplasmic and nuclear CNC rings are highlighted in orange, cyan, pink, and blue, respectively. (B) Cartoon representations of 16 yeast CNC copies from the cytoplasmic side of the NPC coat. Schematics indicating the positions assigned to Nup84CTD and Nup133, which were not crystallized, are shown. (C) Interface between the inner and outer CNC rings. Two views of the yeast CNC and its mate from the inner ring are shown. (D) Orientation of the Nup120 β-propeller relative to neighboring coat nups and the membrane. Portions of two CNCs from the cytoplasmic outer ring are shown in cartoon representation. Green and cyan shading indicates the positioning of Nup84CTD and Nup133, respectively. The cyan line represents the N-terminal unstructured segment of Nup133 that binds to Nup120 (9). A schematic representation of the ring-forming Nup120-Nup133 interaction is shown below.
Figure S1. Structure determination statistics of the yeast CNC. (A) Table of statistics for each step of molecular replacement performed using Phaser for structure determination of the CNC•sAB-57 complex. Each sequential step was performed with the top solutions from the previous step, and a clear separation of the top solutions was apparent with each step. (B) Plots of the initial log-likelihood gain (LLG) scores for the top 10 peaks from the translation function step of Phaser for structure determination of the CNC•sAB-57 complex. (C) Table of statistics for each step of molecular replacement performed using Phaser for structure determination of the CNC•sAB-57•sAB-87 complex. Each sequential step was performed with the top solutions from the previous step, and a clear separation of the top solutions was apparent with each step. (D) Plots of the initial log-likelihood gain (LLG) scores for the top peaks from the translation function step of Phaser for structure determination of the CNC•sAB-57•sAB-87 complex. For each step, there were only a handful of peaks selected from the rotation function, resulting in fewer peaks in the translation function.
Figure S4. Crystal packing in crystals of CNC•sAB-57 and CNC•sAB-57•sAB-87. Representative views of the crystal packing for crystals of the CNC•sAB-57 complex (A) and CNC•sAB-57•sAB-87 complex (B). (left) Uncarved density-modified electron density contoured at 1 σ demonstrates the large solvent channels present in both crystals. (center) Ribbon representation of the asymmetric unit and surrounding symmetry mates colored gray highlights a major crystal contact made in both crystals by a synthetic antibody with the Nup145C•Nup84NTD interface. (right) Combined view of both the electron density and unit cell.
Docked structure (Chimera session)
PDB coordinates (link to PDB site): space group C2, space group P212121
PDBCoordinates (.pdb): space group C2, space group P212121
Structure Factors (.txt): space group C2, space group P212121
Coordinates:
Abstract:
The nuclear pore complex (NPC) constitutes the sole gateway for bidirectional nucleocytoplasmic transport. Despite half a century of structural characterization, the architecture of the NPC remains unknown. Here, we present the crystal structure of a reconstituted ~400 kDa coat nucleoporin complex (CNC) from S. cerevisiae at a 7.4-Å resolution. The crystal structure revealed a curved Y-shaped architecture and the molecular details of the coat nucleoporin interactions forming the central “triskelion” of the Y. A structural comparison of the yeast CNC with an electron microscopy reconstruction of its human counterpart suggested the evolutionary conservation of the elucidated architecture. Moreover, thirty-two copies of the CNC crystal structure docked readily into a cryoelectron tomographic reconstruction of the fully-assembled human NPC, thereby accounting for ~16 MDa of its mass.
California Institute of Technology
Division of Chemistry & Chemical Engineering
1200 E. California Blvd.
Pasadena, CA 91125-7200
© Copyright Hoelz Laboratory

Figure S2. Electron density during structure determination of the yeast CNC. The electron density for the initial molecular replacement and after density modification for the crystal structures of the (A) CNC•sAB-57 and (B) CNC•sAB-57•sAB-87 complexes are shown. Clear density was visible for the triskelion helices after successful placement of previously solved crystal structures (left) and remained after density modification (right), which was performed prior to model building. The models visualized are the direct output from molecular replacement prior to any interpretation.
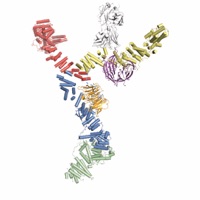
Architecture of the nuclear pore complex coat
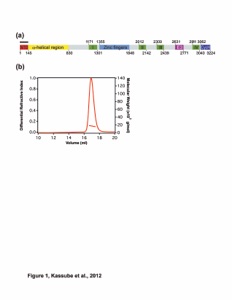
Figure S6. Comparison of the yeast CNC structures from different crystal forms. (A) The structures of the CNC•sAB-57 complex (blue) and CNC•sAB-57•sAB-87 complex (orange) are shown alone and superimposed over the central Sec13•Nup145C core. A view rotated by 90° is shown below. (B) Superposition of previously determined structures of the Nup120NTD, the Sec13•Nup145C•Nup84NTD hetero-trimer and the Seh1•Nup85 pair used for molecular replacement (PDB ID 3F7F, 3IKO, and 3F3F) (6, 8, 9) with their counterparts from the final crystallographic model. Cartoon representations are colored as in Fig. 1, whereas previous structures are colored in gray. Calculated root mean square displacements (rmsds) are indicated for each molecule. Nup85 has a large rmsd due to a large kink in the helical solenoid. Notably, crystal packing interactions of sAB-87 induce a slight rotation of the central triskelion.
Figure S8. Nup120NTD forms no interactions with Nup84NTD, Seh1Nup85, or Sec13Nup145C75-712. (A-C) Gel filtration profiles for the proteins alone: Nup120NTD (A-C, blue), Nup84NTD (A, red), Seh1Nup85 (B, red) and Sec13Nup145C75-712 (C, red) and after pre-incubation of the different complexes (green). Gray bars in the gel filtration profiles indicate the fractions resolved on the SDS-PAGE gels. Molecular mass standards and the positions of the proteins are indicated. Asterisks indicate degradation products. SDS-PAGE gels were stained with Coomassie brilliant blue.
Stuwe, T.S.,# Correia, A.R.,# Lin, D.H., Paduch, M., Lu, V.T., Kossiakoff, A., Hoelz, A.*
(2015). Science, 347, 1148-1152
Figures from the paper:
Figure S9. Seh1Nup85NTD forms no interactions with Nup84NTD, Nup120 or Sec13Nup145C75-712. (A-C) Gel filtration profiles of Seh1Nup85NTD (A-C, blue), Nup120 (A, red), Sec13Nup145C75-712 (B, red), Nup84NTD (C, red) and after pre-incubation (green). Gray bars in the gel filtration profiles indicate the fractions resolved on the SDS-PAGE gels. Molecular mass standards and the positions of the proteins are indicated. Asterisks indicate degradation products. SDS-PAGE gels were stained with Coomassie brilliant blue.
Figure S11. Comparison of the yeast CNC crystal structure and its negative-stain EM reconstruction. Two views of the crystal structure, colored as in Fig. 1, superimposed on the negative-stain EM reconstruction (EMDB-5151 (4)) shown as a gray surface. Portions of the EM reconstruction are shaded green or cyan to indicate components of the complex that were not crystallized.

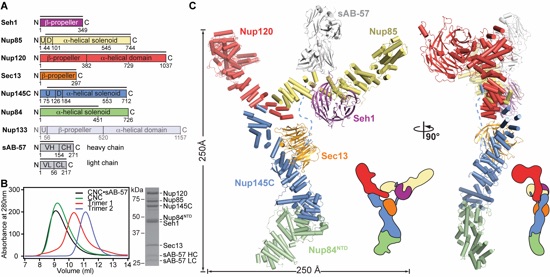
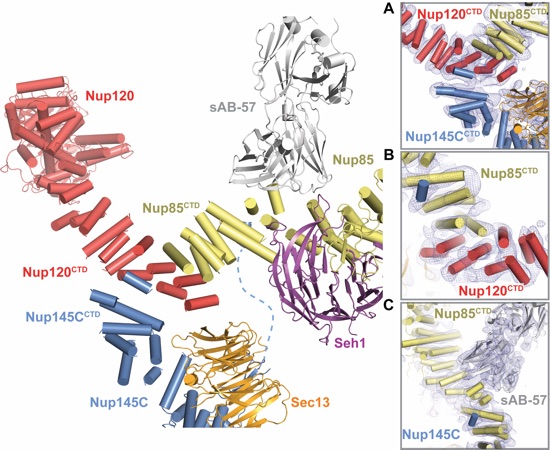
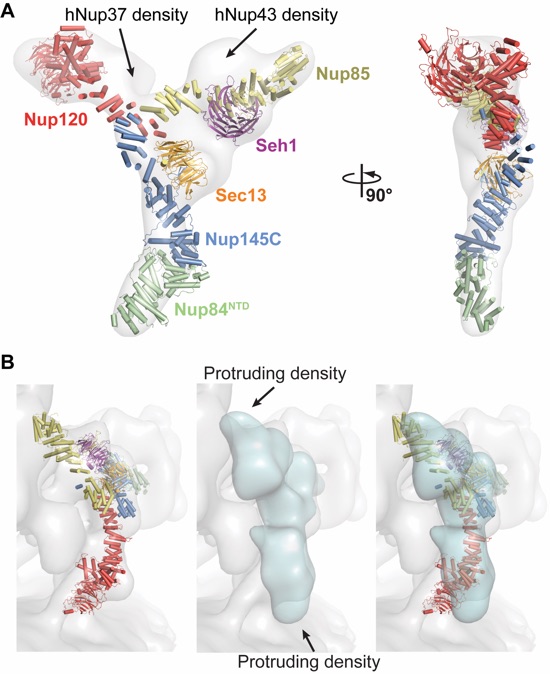
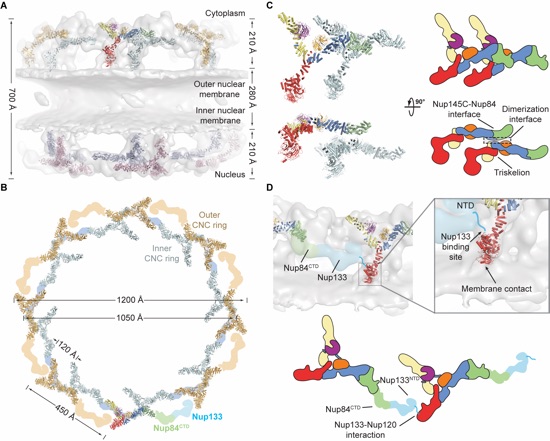
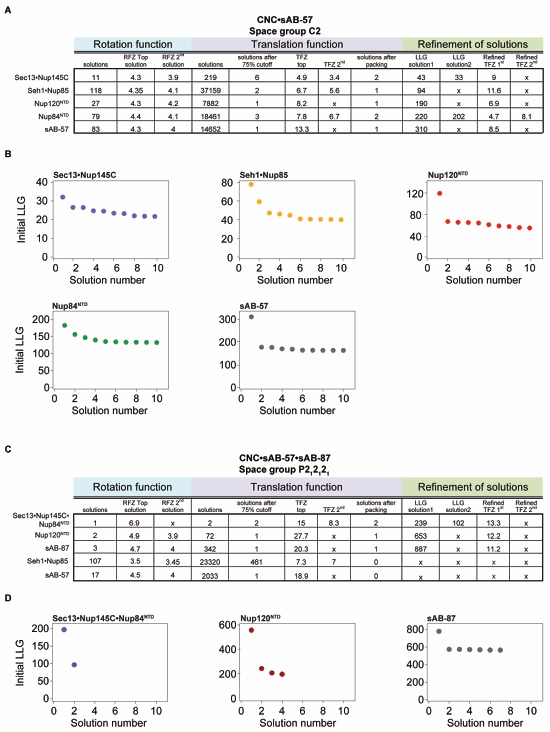
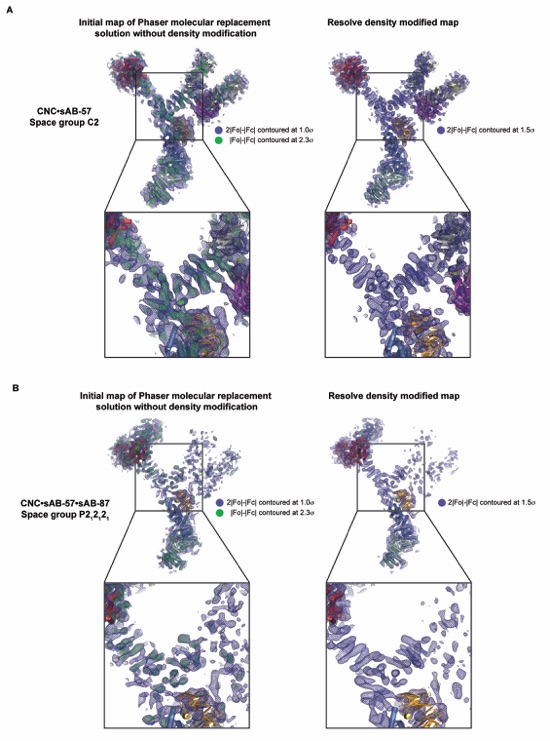
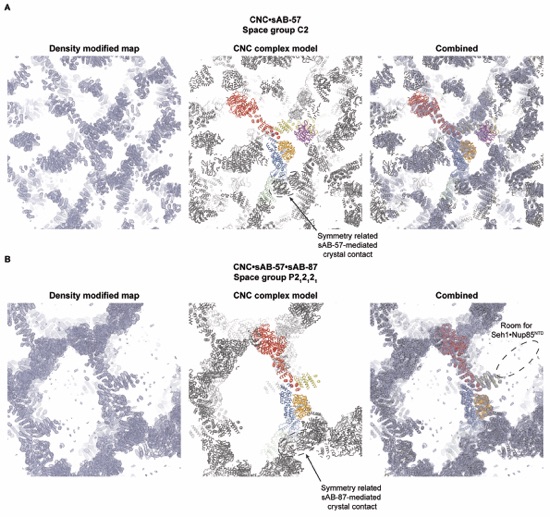
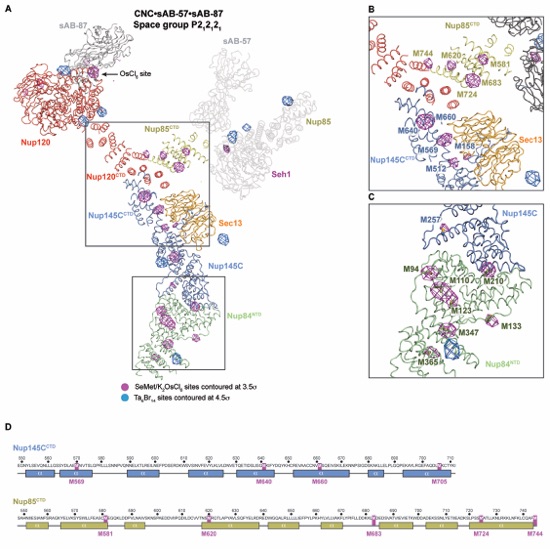
Figure S2. Location of anomalous scatterers in crystals of the CNC•sAB-57•sAB-87 complex. Anomalous difference Fourier maps were calculated for X-ray diffraction data collected at the selenium and tantalum peak wavelengths for CNC•sAB-57•sAB-87 crystals grown with SeMet labeled protein and soaked with K2OsCl6 or native CNC•sAB-57•sAB-87 crystals soaked with tantalum bromide clusters (Ta6Br14). (A) A ribbon representation of the structure of the CNC•sAB-57•sAB-87 complex, with the anomalous difference Fourier maps of X-ray diffraction data collected at the selenium (purple) or tantalum (blue) peak wavelengths contoured at 3.5 σ and 4.5 σ, respectively. Tantalum peaks adjacent to Nup85NTD and a peak corresponding to the last selenium site in Nup85NTD are visible despite the molecule being disordered in the crystal. (B) Close-up view of selenium sites present for the triskelion helices for which there are no high-resolution structures. 8 peaks are visible and confirm the positioning and orientation and approximate sequence assignment in the structure. (C) Close-up view of the selenium peaks in Nup84NTD and Nup145C, with stick representations of the SeMet residues highlighting the expected sites. (D) Sequence and secondary structure prediction of Nup145CCTD and Nup85CTD with methionine residues highlighted.
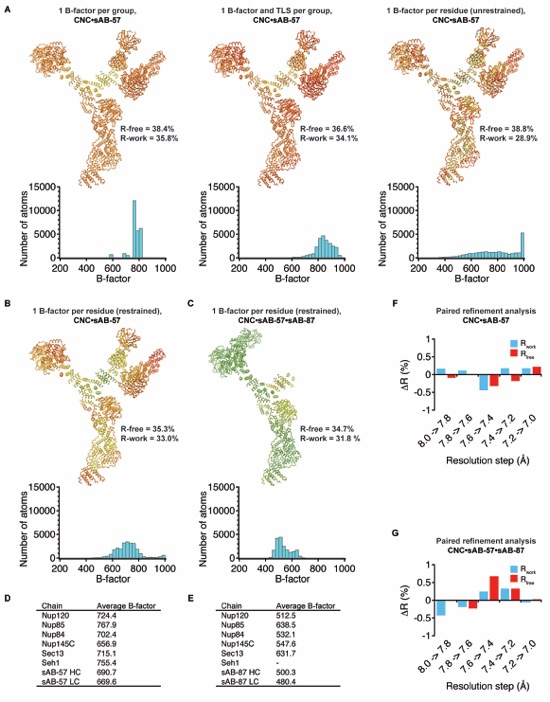
Figure S5. Determination of optimal refinement strategy, resolution limits, and B-factor analysis. (A) Ribbon representations of the CNC•sAB-57 complex colored from blue to red by B-factor for various alternative refinement strategies with histograms of the B-factor distribution below. (B) Ribbon representation of the CNC•sAB-57 complex refined with the final refinement strategy of 1 B-factor per residue and colored on the same scale as in (A). (C) Ribbon representation of the CNC•sAB-57•sAB-87 complex refined with 1 B-factor per residue and colored on the same scale as in (A). (D-E) Average B-factors per protein chain for the CNC•sAB-57 complex (D) or CNC•sAB-57•sAB-87 complex (E). (F-G). Paired refinement analysis of the resolution limit as described by Karplus and Diederichs (25) for the (F) CNC•sAB-57 complex or (G) CNC•sAB-57•sAB-87 complex. The improvement in R-factors gained for each 0.2 Å shell of data was assessed by re-calculating the R-factors in the lower resolution data after refinement with the higher resolution data.
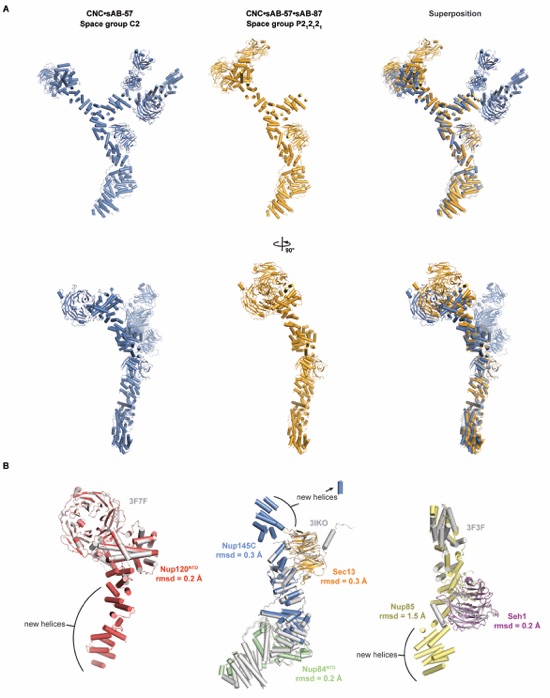
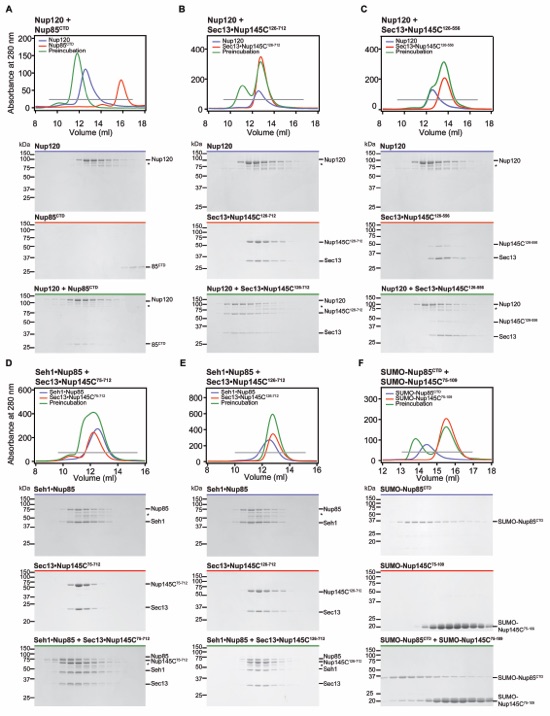
Figure S7. Biochemical characterization of the yeast CNC triskelion. (A-C) Nup120 interactions. Gel filtration profiles for Nup120 (A-C, blue), Nup85CTD (A, red), Sec13Nup145C126-712 (B, red) and Sec13Nup145C126-556 (C, red) and after pre-incubation (green). (D-E) Seh1Nup85 interactions. Gel filtration profiles for Seh1Nup85 (D-E, blue), Sec13Nup145C75-712 (D, red), Sec13Nup145C126-712 (E, red) and after pre-incubation (green). (F) Interaction analysis between Nup85CTD and Nup145C. Gel filtration profiles for SUMO-Nup85CTD (blue) and SUMO-Nup145C75-109 alone (red) and after pre-incubation (green). Gray bars in the gel filtration profiles indicate the fractions resolved on the SDS-PAGE gels. Molecular mass standards and the positions of the proteins are indicated. Asterisks indicate degradation products. SDS-PAGE gels were stained with Coomassie brilliant blue. This size exclusion chromatography data is in agreement with previously published mass spectrometry data, which reported cross-links between Nup120K972 and Nup145CK672,K681,K694, Nup120K943 and Nup145CK681, and Nup120K972 and Nup85K772,K733,K734 (12).
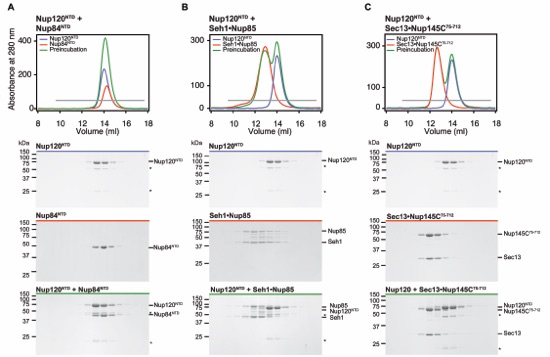
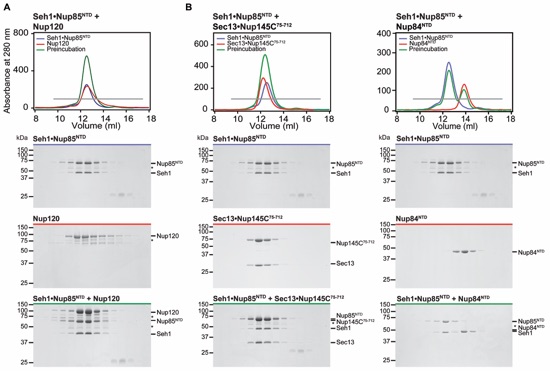
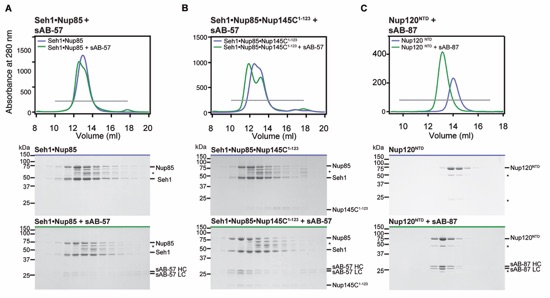
Figure S10. Synthetic antibody (sAB) interactions. (A) sAB-57 interacts with Seh1Nup85. Gel filtration profiles for Seh1Nup85 (blue), Seh1Nup85 preincubated with sAB-57 (green). (B) sAB-57 interacts with Seh1Nup85Nup145C1-123. Gel filtration profiles for Seh1Nup85Nup145C1-123 (blue), Seh1Nup85Nup145C1-123 preincubated with sAB-57 (green). Although sAB-57 can weakly interact with Seh1Nup85 (A), the interaction is only stoichiometric in the presence of Nup145C1-123 (B). (C) sAB-87 interacts with Nup120NTD. Gel filtration profiles for Nup120NTD (blue) and Nup120NTD pre-incubated with sAB-87 (green). Notably, sAB-57 and sAB-87 non-specifically interact with the Superdex 200 resin in the tested buffer conditions and were thus not analyzed in isolation. Gray bars in the gel filtration profiles indicate the fractions resolved on the SDS-PAGE gels. Molecular mass standards and the positions of the proteins are indicated. Asterisks indicate degradation products. SDS-PAGE gels were stained with Coomassie brilliant blue.
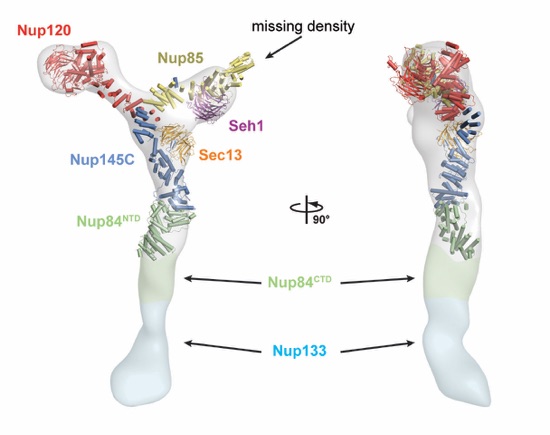
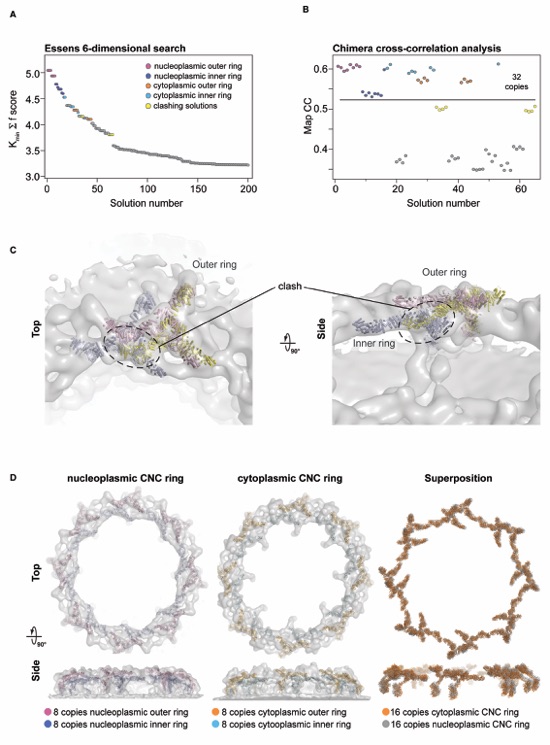
Figure S12. EM docking statistics. (A) The top 200 solutions (out of several thousands) plotted by ranked solution number and score. Top scoring solutions after refinement and rescoring with UCSF Chimera Fit in Map analysis are highlighted. (B) The top 65 solutions which showed a clear separation from the remaining solutions were refined and rescored with the UCSF Chimera Fit in Map tool. The highest 32 scoring solutions could be separated into four groups related by eight-fold rotational symmetry and are colored accordingly. The next highest scoring group of solutions, which clash with the top 32 solutions, is colored in yellow. (C) Analysis of the next highest group of solutions. A member from each of the top scoring group of solutions is shown in cartoon representation, colored as in (A). The third solution clashes with the top two solutions, which are compatible with one another. (D) Comparison of the nucleoplasmic and cytoplasmic rings. Top and side views for the two faces of the NPC are shown with the members of each ring docked into the EM envelope. A superposition of the two rings without the EM density is shown on the right, which highlights the identical arrangement of CNCs despite no a priori information in the map restricting them to be the same.
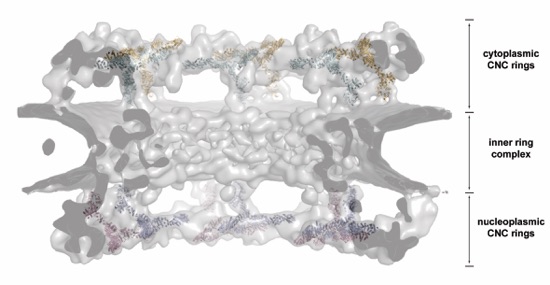
Figure S13. EM docking. A side view of the NPC is shown from within the central channel, highlighting the placement of 32 CNCs to the nuclear and cytoplasmic densities in the cryo-electron tomography reconstruction of the human NPC. The subunit organization of the inner ring remains unknown.
Movie S1. Rotating structure of the yeast CNC in cartoon representation. The yeast CNC is colored according to Fig. 1.
Movie S2. Rotating structure of the yeast CNC docked into the negative-stain EM reconstruction of the yeast CNC. The envelope of the EM reconstruction is shown in gray and the yeast CNC is colored according to Fig. 1.
Movie S3. Rotating structure of the yeast CNC docked into the negative-stain EM reconstruction of the human CNC. The envelope of the EM reconstruction is shown in gray and the yeast CNC is colored according to Fig. 1.
Movie S4. Architecture of the nuclear pore complex coat. Details as discussed in the text. The movie starts with an orientation of the NPC in the same orientation as in Fig. 4A.
