Hoelz Lab: Publications
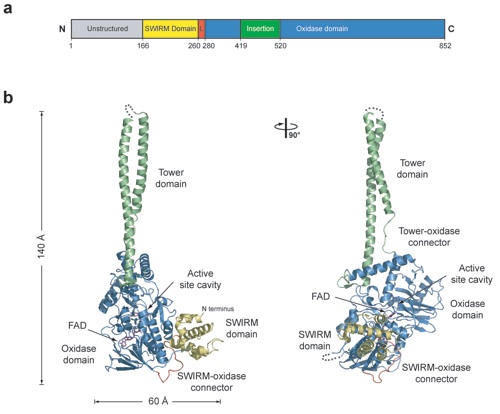
Figure 1. Structure of human LSD1. (a) Domain structure. The unstructured N-terminal region is shown in gray, the SWIRM domain in yellow, the SWIRM-oxidase connector in red, the oxidase domain in blue, and the helical insertion in green. (b) The structure of LSD1 in ribbon representation. Colors are according to A. Dimensions are indicated. A 90º rotated view is shown on the right.

Stavropoulos, P., Blobel, G., Hoelz, A. (2006). Nat. Struct. Mol. Biol. 13, 626-632.*
* Faculty of 1000: must read
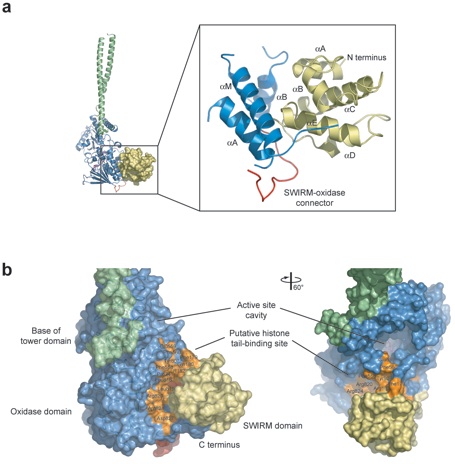
Figure 2. Structure of the SWIRM Domain of LSD1. (a) Ribbon representation of the SWIRM-oxidase interface. The SWIRM domain is shown in yellow, the portion of the oxidase domain involved in the interaction in blue, and the SWIRM-oxidase connector in red. (b) Surface rendition of a close-up view of the cleft formed by the SWIRM and oxidase domains. The surface is colored according to panel a. The residues that form the cleft between the two domains are indicated, and their contribution to the surface is colored in orange. A ~60° rotated view is shown on the right.
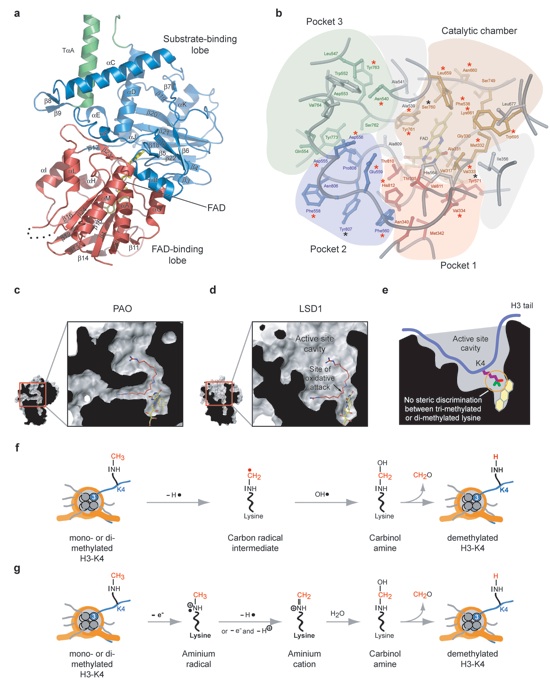
Figure 3. Structure of the oxidase domain and active site cavity of LSD1. (a) Ribbon representation of the oxidase domain of LSD1. The FAD-binding domain is shown in red, the substrate-binding domain in blue, and the tower domain in green. The FAD molecule is shown in yellow stick representation. (b) The catalytic importance of residues in the active site cavity. The locations of the various pockets within the active site cavity are illustrated. Mutated residues that reduce the activity by more than 50% (red stars) and residues that had little effect on the activity (black stars) are indicated. (c) The active site of PAO shown in a cutaway surface rendition to illustrate the U-shaped catalytic channel. The PAO inhibitor Guazatine is shown in red. (d) The active site cavity of LSD1 shown in a cutaway rendition in the same orientation as in panel c. The PAO inhibitor Guazatine is modeled into the active site of LSD1 as a marker for the approximate position of the nitrogen atom of the substrate methylated lysine. (e) Schematic representation of the active site cavity of LSD1 illustrating the approximate positioning of the histone tail and methylated lysine 4. The backbone of the histone tail is illustrated in blue, the side chain of H3-K4 in purple, and the methyl groups in green and red. The two proposed demethylation reaction mechanisms of LSD1 are illustrated in (f) and (g).
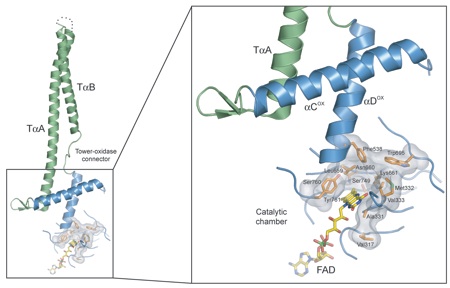
Figure 4. Allosteric regulation of LSD1. The base of the LSD1 tower domain is crucially involved in the formation of the catalytic chamber. The tower helices are show in green, the oxidase domain helices in blue. The catalytic chamber is shown in a transparent surface rendition, with critical residues shown in orange stick representation. The FAD molecule is shown in yellow stick representation.
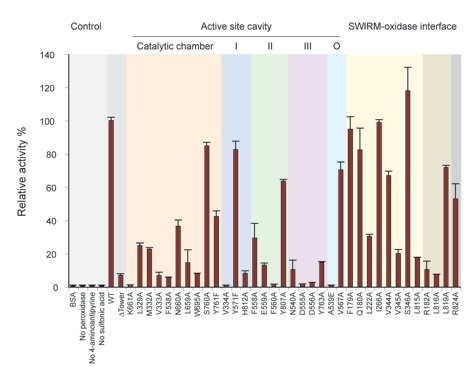
Figure 5. Initial velocities of LSD1 mutants. Initial velocities were determined in a photometric activity assay, using 1 M LSD1 mutant protein and 40 M dimethylated H3-K4 peptide, and normalized against wildtype LSD1 activity. Each data point represents at least three independent measurements. The error bars show the standard deviation. LSD1 mutants are grouped according to their location in the protein: mutants in the active site cavity (catalytic chamber in orange, pocket I in blue, pocket II in green, pocket III in purple, and other residues in the active site cavity (O) in cyan), the SWIRM-oxidase interface (yellow), and putative histone tail-binding groove (gray) are indicated.
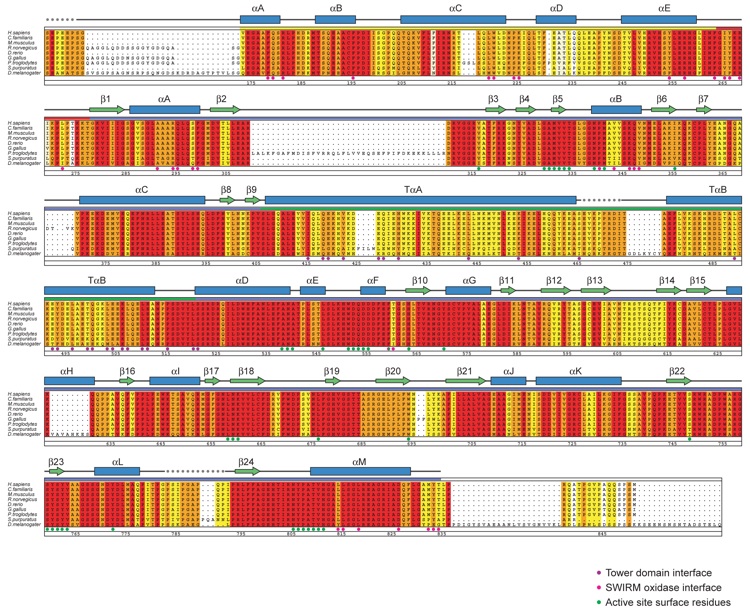
Figure S1. Sequence Alignment. Alignment of LSD1 homologues from H. sapiens (GI:3043726), C. familiaris (GI:73950246), M.musculus (GI:37360004), R. norwegicus (GI:62649867), D. rerio (GI:68387817), G. gallus (GI:50759643), P.troglodytes (GI:55586433), S. purpuratus (GI:72031239), and D. melanogaster (GI:20151661). The secondary structure is indicated above the sequence as blue cylinders (alpha helices), green arrows (beta sheets), gray lines (coil regions), and gray dots (disordered residues). The numbering below the alignment is relative to human LSD1. Overall sequence conservation at each position is shaded in a color gradient from yellow (70% similarity) to dark red (100% identical). The participation of various residues in the formation of the SWIRM-oxidase interface (magenta dots) active site cavity (green dots) and tower domain interface (purple dots) is indicated below the aligned sequences.
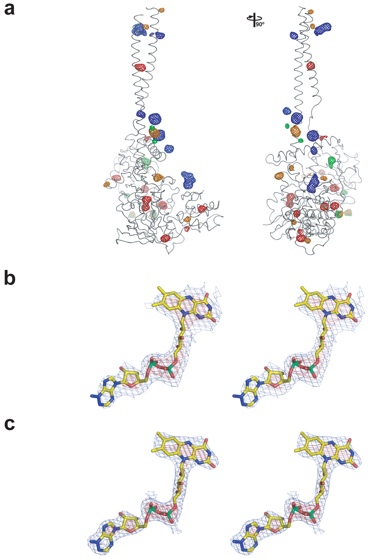
Figure S2. Electron density maps. (a) Anomalous difference Fourier maps, selenium (red), osmium (orange), mercury (green) and [Ta6Br12]2+ cluster (blue). A 90° rotated view is shown on the right. (b) Experimental electron density map rendered at 4.5 σ (red) and 1.0 σ (blue) around the FAD co-factor. (c) Final 2|fo|-|fc| electron density map, rendered at the same σ levels as in panel b.
Figures from the paper:
Coordinates:
Abstract:
The reversible methylation of specific lysine residues in histone tails is crucial in epigenetic gene regulation. LSD1, the first known lysine-specific demethylase, selectively removes monomethyl and dimethyl, but not trimethyl modifications of Lys4 or Lys9 of histone-3. Here, we present the crystal structure of LSD1 at 2.9-A resolution. LSD1 forms a highly asymmetric, closely packed domain structure from which a long helical 'tower' domain protrudes. The active site cavity is spacious enough to accommodate several residues of the histone tail substrate, but does not appear capable of recognizing the different methylation states of the substrate lysine. This supports the hypothesis that trimethylated lysine is chemically rather than sterically discriminated. We present a biochemical analysis of LSD1 mutants that identifies crucial residues in the active site cavity and shows the importance of the SWIRM and tower domains for catalysis.
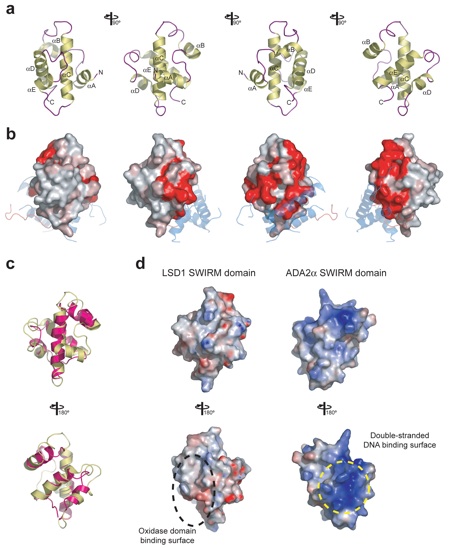
Figure S3. The SWIRM domain of LSD1. (a) Ribbon representation shown from different angles, with helices shown in yellow and coil regions in purple. (b) Surface representation shown from the same angles as in panel a. The surface is colored from gray (< 70% identity) to red (100% identity), according to the sequence conservation in Supplementary Figure 1. The interacting structural elements of the oxidase domain are shown transparently in blue (helices) and red (SWIRM-oxidase connector). (c) Superposition of the SWIRM domains from LSD1 (yellow) and Ada2α (pink) in ribbon representation. A 180° rotated view is shown on the bottom. (d) Surface representations of the SWIRM domains of LSD1 and Ada2α in the same orientation as in panel c. The electrostatic potential is plotted from red to blue onto the surface between -10kBT and +10kBT. The surfaces that are involved in oxidase domain binding (LSD1) and have been implicated in double-stranded DNA binding (Ada2α) are indicated.

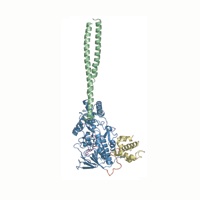
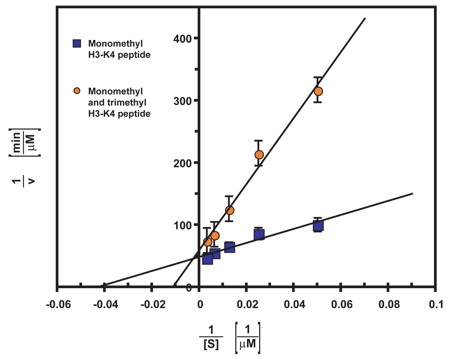
Figure S4. Trimethylated H3-K4 peptide acts as a competitive inhibitor of LSD1 activity. Initial reaction velocities of LSD1 were determined in a photometric activity assay at various concentrations of monomethylated H3-K4 peptide in the absence and presence of trimethylated H3-K4 peptide. Each data point represents at least three independent measurements. The error bars show the standard deviation. The data were fitted by linear regression analysis.
Crystal structure and mechanism of human lysine-specific demethylase-1.
California Institute of Technology
Division of Chemistry & Chemical Engineering
1200 E. California Blvd.
Pasadena, CA 91125-7200
© Copyright Hoelz Laboratory
