Hoelz Lab: Publications
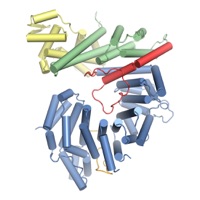
Figure 1. Structural overview of the N-terminal domain of ctNup192. (A) Domain structure of C. thermophilum Nup192 (crystallized fragment indicated by a black bar). The N-terminal Head module (yellow), the HEAT module (green), the hinge module (red), the ARM module (blue), and the C-terminal domain (gray) are indicated. (B) Structure of ctNup192NTD shown in cartoon representation using coloring scheme as in (A). The hinge and α31-α32 loops, which line the inner arch of the ring are colored in red and orange, respectively. Dashed lines indicate disordered loops.

Figure 2. Structural similarity of the ctNup192NTD ARM module to Kap-α. Overview of ctNup192NTD, colored as in Fig. 1B, the Kap-α•bipartite-NLS complex (gray and yellow) (PDB 1EE5) (28), and their superposition on the right.
Figure 3. Surface properties of ctNup192NTD. (A) Surface representation of ctNup192NTD in four different orientations colored as in Fig. 1B. (B) Surface representation of ctNup192NTD colored according to conservation within 7 fungal Nup192 sequences (see also, Fig. S2). Sequence conservation is shaded from white (< 45 % similarity) to yellow (45 % similarity) to red (100 % identity). (C) Surface representation colored according to electrostatic potential from -10 kBT/e (red) to +10 kBT/e (blue).
Figure 4. Biochemical interaction analysis. (A) Domain organization of ctNup53 and ctNic96. Black bars highlight fragments used for interaction analysis. (B, C) SEC analysis of ctNup192NTD with (B) ctNup53N or (C) ctNic96H2. (D, E) SEC analysis of ctNup192CTD with (D) ctNup53N or (E) ctNic96H2. (F) SEC analysis of Kap-α with ctNup53N. (G) SEC analysis of competitive binding between ctNup53N and Kap-α and ctNup192NTD. Gray bars and colored lines designate the analyzed fractions in the respective SDS-PAGE gels stained with Coomassie brilliant blue (Fig. S5B-E, G, H).
Figure 5. Mutational analysis of the ctNup53 interactions with ctNup192 and Kap-α. (A) Sequence comparison of ctNup5331-67 with a consensus classical bipartite NLS and summary of the effects of ctNup5331-67 mutations on ctNup192NTD and Kap-α binding. Basic residues are highlighted in blue, dots indicate mutations that cause no effect (green), reduced binding (orange), or complete disruption (purple). See also Fig. S6A, B. (B) Mutational analysis of the ctNup192NTD-ctNup5331-67 interaction. Mutations that have no effect (-, black), reduce binding (+, orange), or abolish the interaction (+++, red) are indicated. See also Fig. S7A. (C) Surface mapping of ctNup192NTD mutagenesis results. As reference, a cartoon representation of ctNup192NTD, colored as in Fig. 1B is shown on the left. The locations of mutations on the ctNup192NTD surface are labeled and colored in green, orange, and red to indicate no effect, reduced binding, or complete disruption of ctNup5331-67 binding, respectively.
Figure S1. Structure determination and oligomeric state analysis of ctNup192NTD. (A) The two molecules in the asymmetric unit are shown in a ribbon representation and colored in blue and light blue. Anomalous difference Fourier maps of the Ta6Br12 cluster (green) and seleno-L-methionine labeled protein (red) derivatives are contoured at 10.0 σ and 5.0 σ, respectively. (B) Representative final 2|FO|-|FC| density map contoured at 1.0 σ. (C) SEC-MALS analysis of ctNup192NTD. The normalized differential refractive index (blue) is plotted against the elution volumes from a Superdex 200 10/300 GL gel filtration column and overlaid with the experimental molecular mass for the peak fractions (red). The determined molecular mass for ctNup192NTD is 105.0 kDa (theoretical 108.8 kDa). (D) Schematic representation of the α-helical motifs identified in ctNup192NTD. The Head module includes helices α1-α8 and a β-hairpin composed of β-strands β1-β2. The HEAT module is composed of three HEAT repeats, helices α9-α14, and is connected to the ARM module via the hinge module which contains helices α15 and α16. The ARM module contains 8 turns of a right-handed superhelix composed of helices α 17-42. HEAT and ARM repeats are numbered and highlighted below the helices with dashed lines indicating deviations from canonical ARM repeats.
Coordinates:
Abstract:
Nucleocytoplasmic transport is facilitated by nuclear pore complexes (NPCs), which are massive proteinaceous transport channels embedded in the nuclear envelope. Nup192 is a major component of an adaptor nucleoporin subcomplex proposed to link the NPC coat with the central transport channel. Here, we present the structure of the ~110 kDa N-terminal domain (NTD) of Nup192 at 2.7-Å resolution. The structure reveals an open ring-shaped architecture composed of HEAT and ARM repeats. A comparison of different conformations indicates that the NTD consists of two rigid halves connected by a flexible hinge. Unexpectedly, the two halves of the ring are structurally related to karyopherin-α and β-karyopherin family members. Biochemically, we identify a conserved patch that binds an unstructured segment in Nup53 and show that a C-terminal tail region binds to a putative helical fragment in Nic96. The Nup53 segment that binds Nup192 is a classical nuclear localization-like sequence that interacts with karyopherin-α in a mutually exclusive and mechanistically distinct manner. The disruption of the Nup53 and Nic96 binding sites in vivo yields growth and mRNA export defects, revealing their critical role in proper NPC function. Surprisingly, both interactions are dispensable for NPC localization, suggesting that Nup192 possesses another nucleoporin interaction partner. These data indicate that the structured domains in the adaptor nucleoporin complex are held together by peptide interactions that resemble those found in karyopherincargo complexes and support the proposal that the adaptor nucleoporins arose from ancestral karyopherins.
California Institute of Technology
Division of Chemistry & Chemical Engineering
1200 E. California Blvd.
Pasadena, CA 91125-7200
© Copyright Hoelz Laboratory

Figure 6. In vivo analyses of Nup192 and Nup53 mutants in S. cerevisiae. (A) The nup192Δ shuffle strain containing a mCherry-Nup192 cover plasmid (URA3) was transformed with control or GFP-Nup192 variants (Leu). Growth was followed on SDC-Leu and 5-FOA/SDC plates for the indicated times and temperatures. (B,C) In vivo localization of GFP-Nup192 variants in the nup192Δ strain visualized by fluorescence and differential interference contrast (DIC) microscopy. Cells in (C) still carry the mCherry-Nup192 full-length plasmid. (D) Growth analysis of nup192Δ and nup53Δnup59Δ strains. Cells were spotted on YPD plates and grown for 2-4 days at the indicated temperatures. (E) mRNA export assay of GFP-Nup192 variants. Representative images of wildtype GFP-Nup192 (top) and GFP-Nup192∆TAIL (bottom) complemented nup192Δ cells are shown. Quantification of nuclear poly(A) mRNA retention is shown on the right. Error bars indicate standard deviations derived from six independent images, each containing ~100 cells. Scale bars are 5 μm.
Figure 7. Model for the ctNup192 interaction network. The structure of ctNup192NTD is docked into the EM envelope of full-length ctNup192 (21). General location of the interaction sites for Nup5331-67 (top) and Nic96H2 (bottom) on Nup192 are shown. The location of a yet to be identified nup interaction site is indicated.
Evidence for an evolutionary relationship between the large adaptor nucleoporin Nup192 and karyopherins
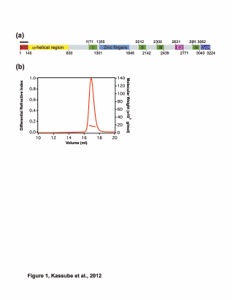

Figure S2. Multi-species sequence alignment of Nup192NTD. Seven diverse fungal species were aligned and colored by sequence similarity according to the Blosum62 matrix from white (less than 45 % similarity) to yellow (45 % similarity) to red (100 % identity). The numbering is according to C. thermophilum Nup192NTD. Secondary structure is indicated above the sequence as rectangles (α-helices), arrows (β-strands), and lines (unstructured regions). Secondary structure elements are colored according to Fig. 1. Dots in the secondary structure plot indicate residues that reduce (orange) or completely disrupt (red) the ctNup53 interaction upon mutation to alanine. An asterisk indicates the position of the invariant glycine 371 between hinge helices α15 and α16.
Figure S3. Analyses of the ARM and HEAT repeats in ctNup192NTD. (A) Overview of the structures of ctNup192NTD, Cse1p (grey, PDB 1WA5) (31), and their superposition on the right. Bottom panels depict 90º rotated views of the above structures. (B) An overview of the ctNup192NTD structure is shown on the left with the ARM repeats highlighted in blue. The structural superposition of the ctNup192NTD ARM repeats and ARM repeat 7 of Kap-α (PDB 1BK5) (11) is shown in the middle and the structure-guided sequence alignment is shown on the right. Consensus hydrophobic positions are indicated below with asterisks and those residues that match these positions are highlighted in red. (C) The ctNup192NTD HEAT repeats are highlighted in green on the left and their structural superposition with HEAT repeat 11 from Cse1p (PDB 1WA5) (31) is shown in the middle. A structure-guided sequence alignment is shown on the right, with consensus hydrophobic positions highlighted as in (B).
Figures from the paper:
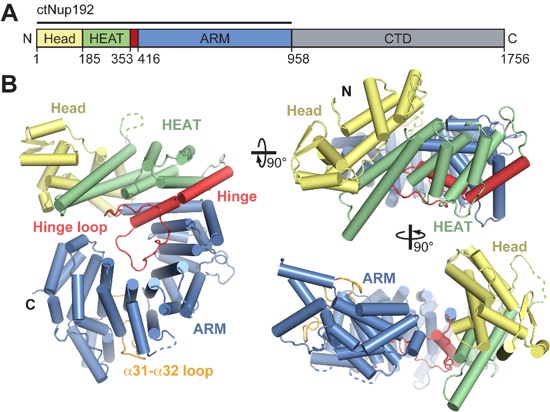

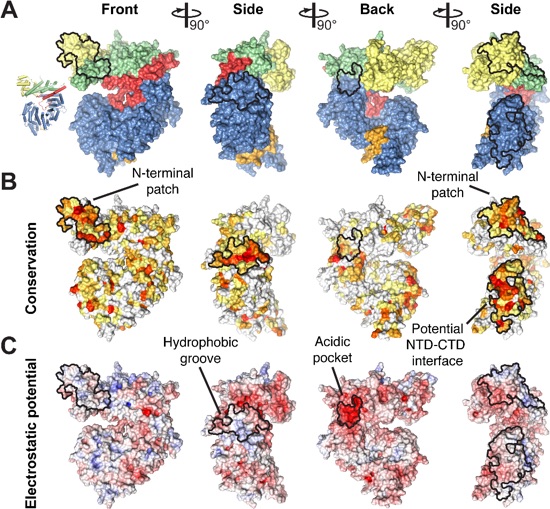
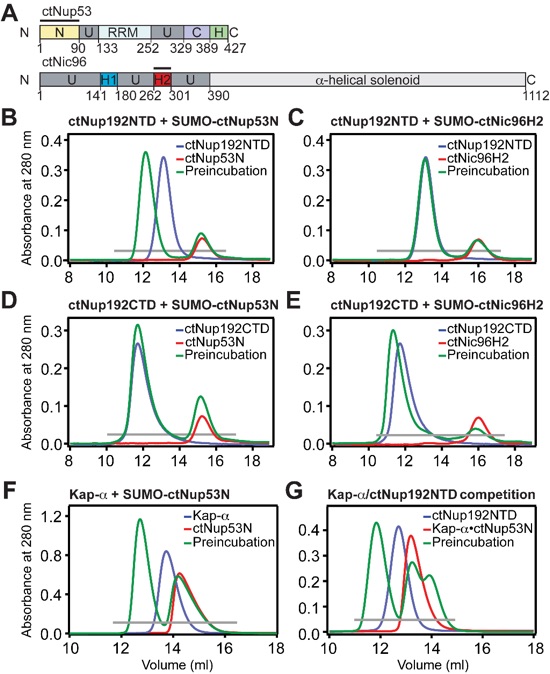
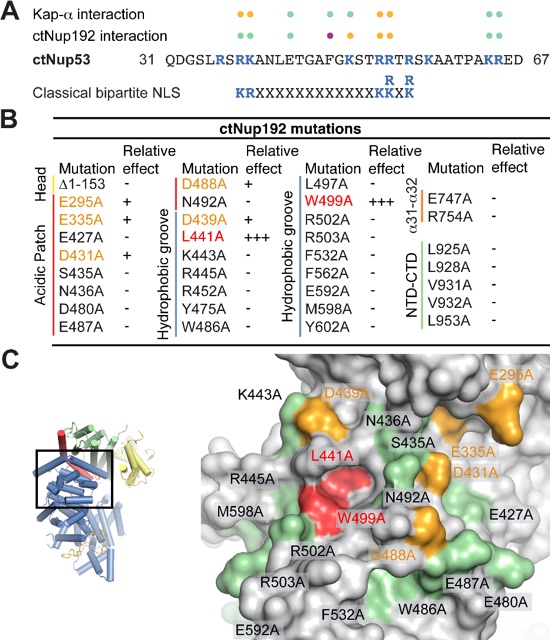
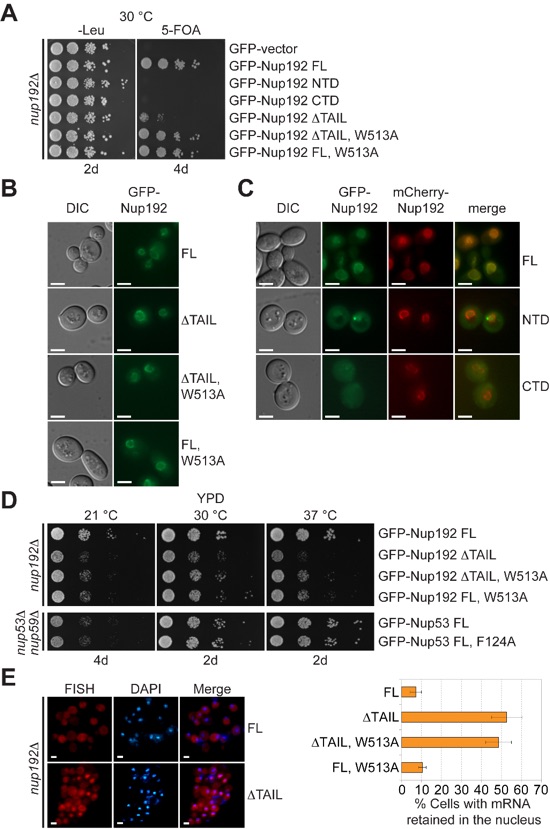

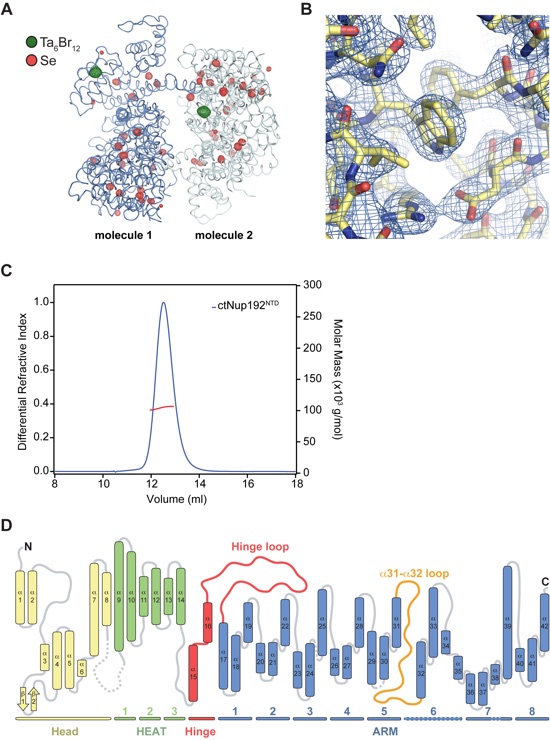

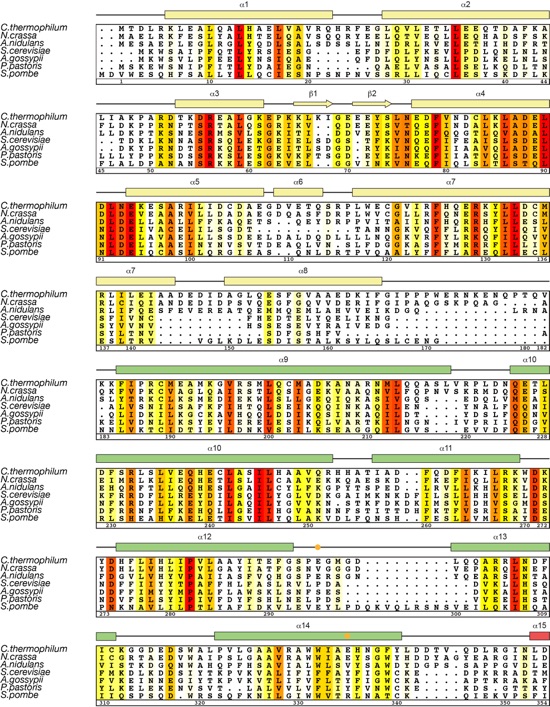
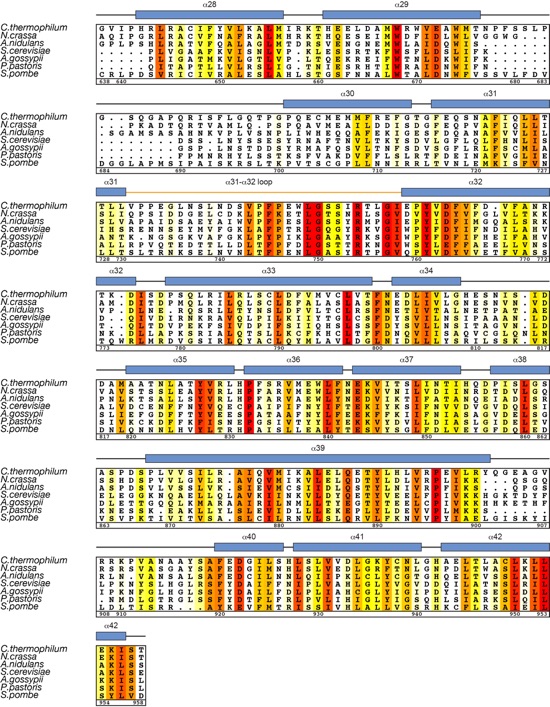


Figure S4. Conformational plasticity of Nup192NTD. (A) Structures of ctNup192NTD (left and middle) and scNup192NTD (right, PDB 4IFQ) (6) depicted in surface representation. Their alignment on the C-terminal ARM module reveals conformational changes that are accompanied with an increased opening of the ring. The hinge module of each structure is colored in red and indicated by a black triangle. In the bottom panels, 90º rotated views show that the Head and HEAT modules also rotate along an axis out of the plane of the ring, reminiscent of the opening of a lock-washer. (B) Cartoon representations of ctNup192NTD and scNup192NTD are shown in the same orientation, coloring, and order as in (A). (C) Superposition of the closed and intermediate states of Nup192NTD. (D) Superposition of the intermediate and open states of Nup192NTD. A large change in the conformation of the hinge loop of scNup192NTD, highlighted by the black circle, is propagated to the hinge helices (α15 and α16), causing the ring to adopt a further open state. Arrows indicate the observed conformational changes of the hinge helices from the closed to the intermediate to the open states.
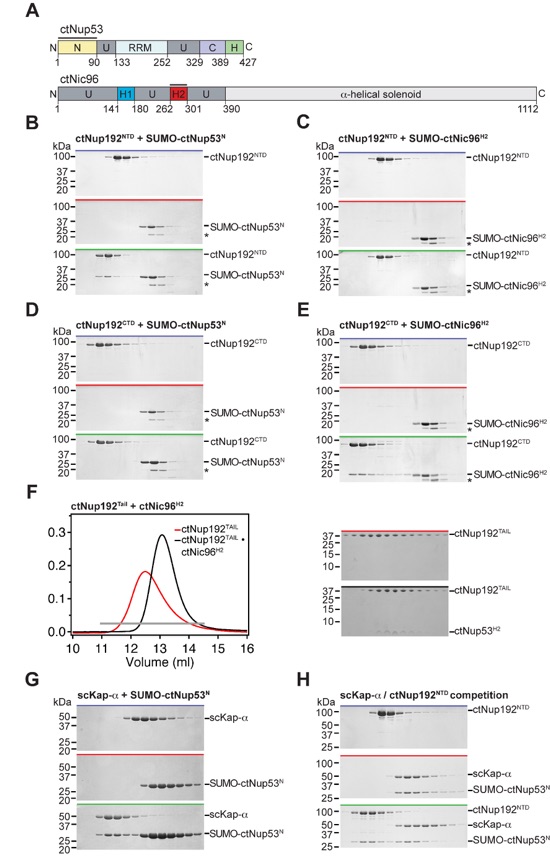
Figure S5. Biochemical analysis of ctNup192 interactions. (A) Schematic overview of the domain organization of C. thermophilum Nup53 and Nic96. (B-E) SDS-PAGE gels corresponding to the fractions indicated by gray bars in the gel filtration profiles of Fig. 4B-E. (F) Interaction between ctNup192TAIL and ctNic96H2. SEC profiles of purified ctNup192TAIL alone or the purified ctNup192TAIL•ctNic96H2 complex are shown on the left, with the corresponding SDS-PAGE gels shown on the right. The gray bar indicates the fractions analyzed. (G, H) SDS-PAGE gels corresponding to the fractions indicated by gray bars in the gel filtration profiles of Fig. 4F, G. Molecular mass standards and the positions of the proteins are indicated. Asterisks indicate degradation products of SUMO-ctNic96H2. SDS-PAGE gels were stained with Coomassie brilliant blue.
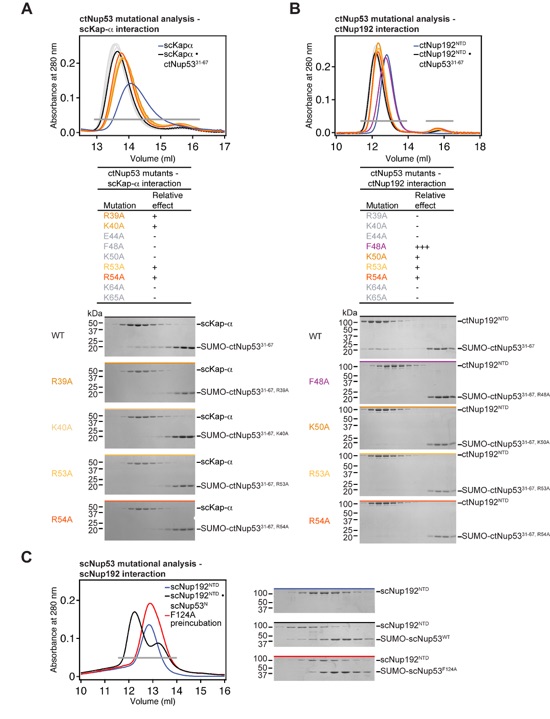
Figure S6. Mutational analysis of Nup53 interactions. (A-B) SEC interaction profiles of ctNup5331-67 mutants and their effect on (A) Kap-α and (B) ctNup192NTD binding. The results are summarized in Fig. 5A. Relative effects are categorized as no effect (-), reduced binding (+), and complete disruption (+++). Gray bars indicate fractions analyzed by Coomassie brilliant blue-stained gels. The corresponding gel filtration profiles are indicated by the colored bar above each gel. Molecular mass standards and the positions of the proteins are indicated. (C) Mutational analysis of S. cerevisiae Nup192NTD and Nup53. The corresponding mutation F124A in scNup53N also disrupts binding to scNup192NTD, as shown by SEC analysis.
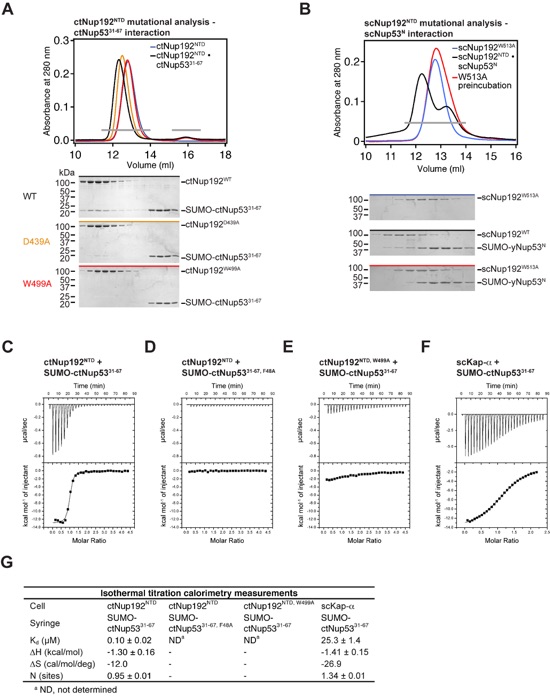
Figure S7. Mutational analysis of Nup192NTD interactions. (A) Representative SEC interaction profiles of ctNup192NTD mutants and their effect on ctNup5331-67 binding. Results are summarized in Fig. 5B. Representative gel filtration profiles illustrating reduced binding and complete disruption of the interaction are shown in orange and red, respectively. Gray bars indicate fractions analyzed by Coomassie brilliant blue-stained gels. The corresponding gel filtration profiles are indicated by the colored bar above each gel. Molecular mass standards and the positions of the proteins are indicated. (B) Mutational analysis of S. cerevisiae Nup192NTD and Nup53. The corresponding mutation W513A in scNup192NTD also disrupts binding to scNup53N, as shown by SEC analysis. (C-F) Isothermal titration calorimetry analysis of ctNup5331-67 interactions. (G) Summary of the thermodynamic parameters determined using a single-site model.

Figure S8. Structural basis for distinct large adaptor nucleoporin binding specificity. (A) SEC analysis of the interaction between ctNup188NTD and ctNup5331-67. Gray bars and colored lines designate the analyzed fractions in the respective Coomassie brilliant blue-stained SDS-PAGE gels on the right. Molecular mass standards and the positions of the proteins are indicated. (B) Cartoon representations of ctNup192NTD, mtNup188NTD (PDB 4KF7) (32), and their superposition on the right. mtNup188NTD-specific insertions are colored in magenta. (C) Comparison of the ctNup53 binding site in ctNup192NTD with the corresponding location in mtNup188NTD, colored as in (B).

Stuwe, T.S.,# Lin, D.H.,# Collins, L.M., Hurt, E., Hoelz, A.*
(2014). Proc. Natl. Acad. Sci. USA, 111, 2530-2535