Hoelz Lab: Publications
Figure 1. Biochemical analysis of the SIRT1CAT•CTR complex. (a) Domain structure. Blue, NAD+-binding domain; yellow, helical module; green, Zn2+-binding module; red, pseudo-substrate peptide (T, tail); purple, C-terminal regulatory segment (CTR); grey, predicted unstructured regions (U). The bars above the domain structure mark the crystallized fragments. (b) Size-exclusion chromatography interaction analysis of SIRT1CAT with SUMO-CTR. The analyzed proteins and complexes are indicated in each gel filtration profile. For analysis of complex formation, the SUMO-CTR was mixed at approximately 2-fold molar excess of SIRT1CAT and injected onto a Superdex 200 10/300 GL gel filtration column. Gray bars and colored lines designate the analyzed fractions. Molecular mass standards and the positions of the proteins are indicated. The asterisk indicates a degraded SUMO-CTR fragment. (c) Multiangle light scattering (MALS) analysis of the SIRT1CAT•CTR heterodimer. The differential refractive index is plotted against the elution volume from a Superdex 200 10/300 GL gel filtration column and overlaid with the determined molecular mass for the peak.

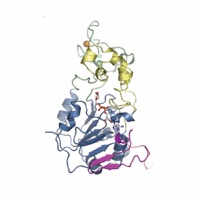
Figure 2. Structure of H. sapiens SIRT1. (a) Structure of the quaternary SIRT1CAT•CTR•ADPR•Substrate complex in ribbon representation, colored as in Fig. 1a. (b) Structure of the SIRT1CAT•CTR heterodimer, displayed in the same orientation as in panel (b). 90°-rotated views are shown on the right. See also Figs. S1 and S3.
Figure 3. Interface between SIRT1CAT and the C-terminal regulatory segment. Ribbon representation of the interface between the SIRT1CAT and the CTR colored according to Fig. 1a. The inset illustrates the position of the CTR-binding site on the larger NAD+-binding domain and its interacting residues and is expanded on the right. Residues participating in the interface are shown in ball-and-stick representation.
Figure 4. Structural comparison of H. sapiens SIRT1 to a bacterial Sir2 substrate complex. (a) A ribbon representation of SIRT1CAT•CTR•ADPR•Substrate (left, colored as in Fig. 1a), T. maritima Sir2 in complex with a p53 peptide (middle), and a superposition of the two (right). (b) A stick representation of the pseudo-substrate and p53 substrate peptide from the corresponding structures in panel (a) and their superposition. The PDB code of the TmSir2 structure is 2H59.29 (c) Final 2|fo|-|fc| electron density map around the ADPR and pseudo-substrate peptide rendered at 1.0 σ. See also Fig. S4.
Figure 5. Structural comparison of open and closed SIRT1 states. (a) Ribbon representations of the closed SIRT1CAT•CTR•ADPR•Substrate state, (b) the open SIRT1CAT•CTR conformation, and (c) a superposition of the two. (d, e) Surface representations of the corresponding structures in panels (a) and (b). A 90°-rotated view is shown on the right. (f) A model of pseudo-substrate peptide and ADPR binding to the open SIRT1CAT•CTR state. A 90°-rotated view is shown on the right. See also Fig. S2.
Figure 8. Thermostability assay. (a) SIRT1CAT was incubated alone and in the presence of SUMO-CTR or a non-interacting SUMO-CTRY650D, I651D mutant at the indicated temperatures for one hour and pelleted by centrifugation. Pellet and supernatant fractions were visualized by SDS-PAGE, followed by Coomassie brilliant blue staining. Molecular mass standards and the positions of the proteins are indicated. (b) Deacetylase activity of SIRT1CAT and the SIRT1CAT•CTR heterodimer under normal conditions (red) and following incubation at 37 °C for approximately 2 hours prior to the assay (blue). Activity was determined in a fluorescence-based assay and normalized against wild-type SIRT1CAT activity. Each data point represents the mean of at least three independent measurements. Error bars represent standard deviations. The loss of deacetylase activity is attributed to the aggregation of the catalytic domain.
PDB coordinates (link to PDB site) - SIRT1CAT•CTR, SIRT1CAT•CTR•ADPR
PDBCoordinates (*.pdb) - SIRT1CAT•CTR, SIRT1CAT•CTR•ADPR
Structure Factors (.txt) - SIRT1CAT•CTR, SIRT1CAT•CTR•ADPR
Figures from the paper:
Coordinates:
Abstract:
SIRT1 is a NAD+-dependent deacetylase that plays important roles in many cellular processes. SIRT1 activity is uniquely controlled by a C-terminal regulatory segment (CTR). Here we present crystal structures of the catalytic domain of human SIRT1 in complex with the CTR in an open apo form and a closed conformation in complex with a cofactor and a pseudo-substrate peptide. The catalytic domain adopts the canonical sirtuin fold. The CTR forms a β hairpin structure that complements the β sheet of the NAD+-binding domain, covering an essentially invariant, hydrophobic surface. The apo form adopts a distinct open conformation, in which the smaller subdomain of SIRT1 undergoes a rotation with respect to the larger NAD+-binding subdomain. A biochemical analysis identifies key residues in the active site, an inhibitory role for the CTR, and distinct structural features of the CTR that mediate binding and inhibition of the SIRT1 catalytic domain.
California Institute of Technology
Division of Chemistry & Chemical Engineering
1200 E. California Blvd.
Pasadena, CA 91125-7200
© Copyright Hoelz Laboratory

Figure 6. Mutational analysis. (a) Ribbon representation of the SIRT1CAT•CTR•ADPR•Substrate complex, with a stick representation of all mutated active side residues. The Zn2+-binding and helical modules were removed for clarity. (b) Ribbon representation of the SIRT1CAT•CTR•ADPR•Substrate complex, with a stick representation of all mutated SIRT1CAT-CTR interface residues. (c) Deacetylase activity of SIRT1 proteins and mutants towards modified p53-based peptides. Activity was determined in a luminescence (red) or fluorescence (blue) based assay and normalized against wild-type SIRT1CAT activity. Each data point represents the mean of at least three independent measurements. Error bars represent standard deviations. See also Fig. S5.
Figure 7. Exchange of the C-terminal regulatory segment. (a) Size-exclusion chromatography interaction analysis of the SIRT1CAT•CTR heterodimer with SUMO-CTR. The analyzed proteins and complexes are indicated in each gel filtration profile. For analysis of complex formation, SUMO-CTR was mixed at approximately 2-fold molar excess and injected onto a Superdex 200 10/300 GL gel filtration column. Gray bars and colored lines designate the analyzed fractions. Molecular mass standards and the positions of the proteins are indicated. Untagged CTR is too small to be visualized on the SDS-PAGE. (b) GST pull-downs of a preformed GST-CTR•SIRT1CAT complex with increasing amounts of SUMO-CTR. The loaded (top) and pulled-down (bottom) samples are visualized by SDS-PAGE, followed by Coomassie brilliant blue staining. As reference, the first two lanes of each gel contain the loaded samples of GST-CTR•SIRT1CAT and SUMO-CTR. The relative molar amounts of GST-CTR•SIRT1CAT and SUMO-CTR, molecular mass standards and the positions of the proteins are indicated. (c) CTR mutational analysis. His-tagged SIRT1CAT and GST-tagged CTR variants were coexpressed in E. coli and the resulting soluble lysate fraction was analyzed in GST pull-down assays. Samples were visualized by SDS-PAGE, followed by Coomassie brilliant blue staining. Molecular mass standards and the positions of the proteins are indicated. The asterisk indicates a degraded GST-CTR fragment.
Structural and Functional Analysis of Human SIRT1

Figure 9. Model for the conformational changes and regulation of SIRT1. A cartoon representation of the apo SIRT1CAT•CTR heterodimer (left) and the SIRT1CAT•CTR•ADPR•Substrate complex (right), colored as in Fig. 1a. Substrate and co-factor binding leads to the closure of the SIRT1 catalytic domain. The substrate peptide is primarily bound by backbone interactions and the formation of a three-stranded anti-parallel β staple. The hydrophobic acetylated lysine substrate residue reaches into the secluded internal active site through the hydrophobic tunnel where it is oriented in close proximity to the activated NAD+. In the closed state, the CTR forms a salt-bridge with the helical module, thereby reducing the efficiency of catalysis.
Figure S1. Multispecies sequence alignment of SIRT1 homologs. (a) A multispecies sequence alignment of the SIRT1 catalytic domain and (b) the C-terminal regulatory segment (CTR). The numbering below the alignment is relative to H. Sapiens SIRT1. The overall sequence conservation at each position is shaded in a color gradient from yellow (60 % identity) to dark red (100 % identity). The secondary structure is indicated above the sequence as arrows (β strands) or rectangles (α helices), and colored as in Fig. 1a. Residues that comprise the interface between SIRT1CAT and the N-terminal region of the CTR (magenta and light blue dots), or between SIRT1CAT•CTR and the pseudo-substrate peptide (green and dark blue dots) are indicated below the aligned sequences. Gray dots indicate the invariant cysteine residues that mediate Zn2+-binding.

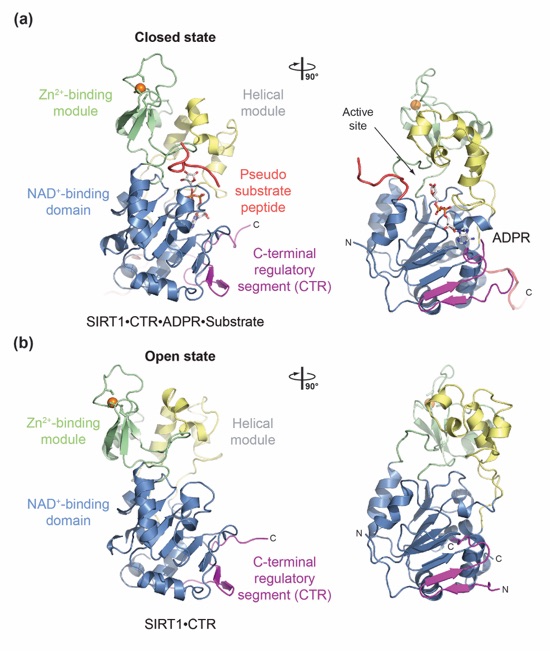


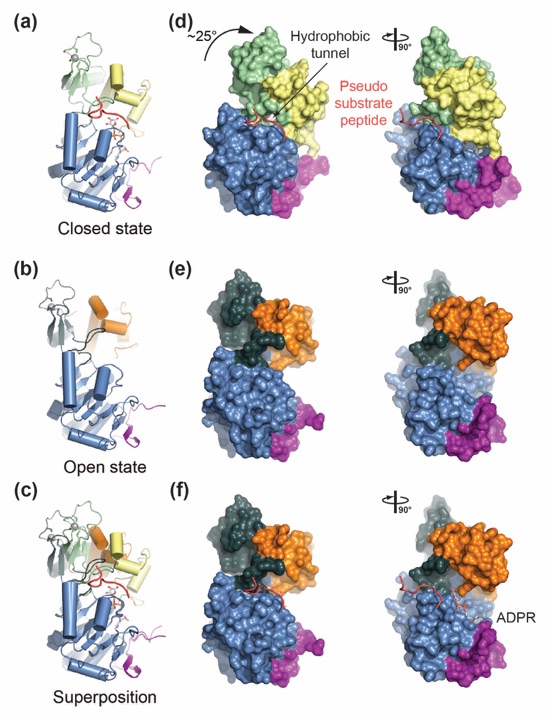


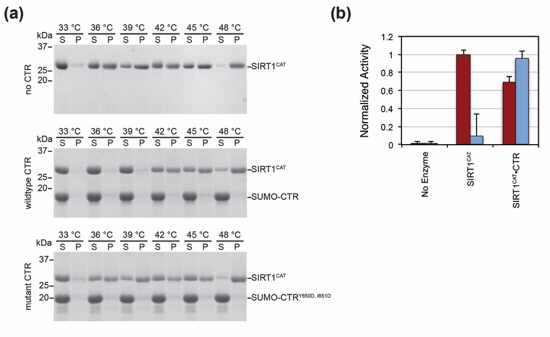

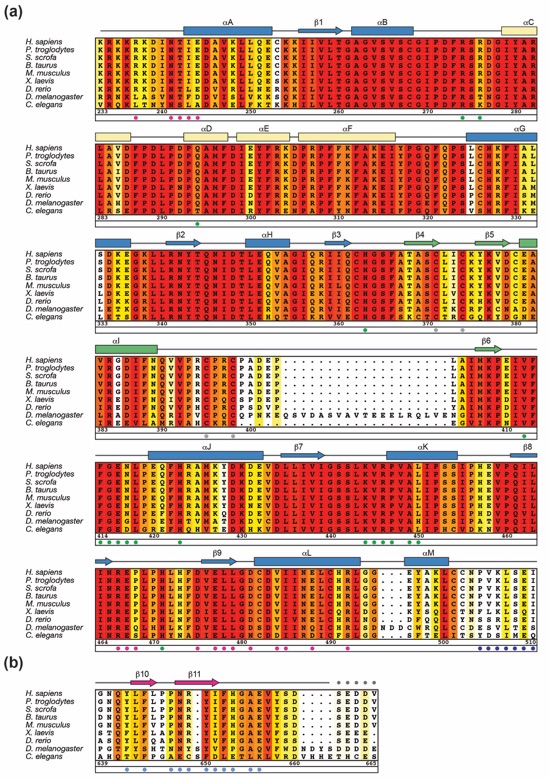

Figure S2. Structural comparison of SIRT1 structures. (a) Ribbon representations of the closed SIRT1CAT•CTR•ADPR•Substrate structure (left), the recently determined SIRT1CAT•NAD+•EX527 analog structure (middle) and a superposition of the two (right). (b) Ribbon representations of the closed SIRT1CAT•CTR•ADPR•Substrate structure (left), the recently determined scSir2•ADPR•scSir4 structure (middle) and a superposition of the two (right). For clarity, scSir4 and the N-terminal domain of scSir2 have been removed. The PDB codes for the SIRT1CAT•NAD+•EX527 analog and scSir2•ADPR•scSir4 structures are 4I5I and 4IAO, respectively.1,2
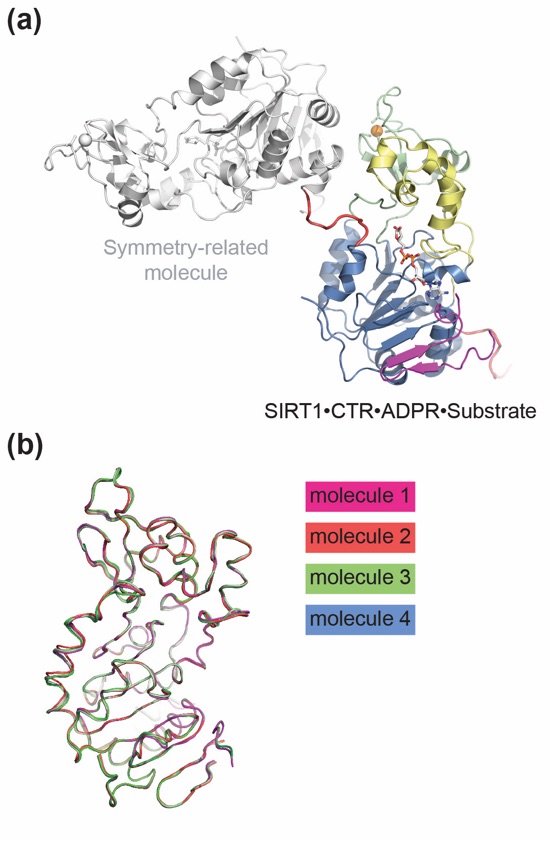
Figure S3. Crystallographic analysis. (a) Ribbon representation of the SIRT1CAT•CTR•ADPR•Substrate complex, colored according to Fig. 1. A symmetry-related molecule, colored in gray, provides the p53-mimicking pseudo-substrate peptide (red). (b) Superposition of the four copies of the apo SIRT1CAT•CTR heterodimer in the asymmetric unit.

Figure S4. Analysis of oligomeric state. MALS analysis of the SIRT1CAT•CTR complex in the presence of 5 mM NAD+. The differential refractive indices of SIRT1CAT•CTR are plotted against the elution volumes from a Superdex 200 10/300 GL gel-filtration column (GE Healthcare) and are overlaid with the determined molecular mass for the selected peak.

Figure S4. SIRT1 mutant proteins. The purified proteins used in all experiments visualized by SDS-PAGE, followed by Coomassie brilliant blue staining. The molecular mass standards and the positions of the proteins are indicated. The CTR is too small to be visualized on the gel.

Davenport, A.M., Huber, F.M., Hoelz, A.*
(2014). J. Mol. Biol. 426, 526-541