Hoelz Lab: Publications
Fig. 1. Reconstitution of NPC symmetric core protomers. (A) Cross-sectional conceptual schematic of the NPC. CNCs, colored yellow, form outer rings above the membrane on the nuclear and cytoplasmic faces. Adaptor and channel nucleoporins, respectively colored orange and red, form concentric cylinders in the inner ring. Asymmetric nucleoporins are present on the cytoplasmic and nuclear faces of the NPC. (B) Domain organization of nucleoporins used in biochemical reconstitution experiments. Black lines indicate the construct boundaries used. Domains are drawn as horizontal boxes with residue numbers indicated below and are colored according to the legend (bottom right) for observed or predicted folds. Cartoons to the right are used throughout the figures to represent the nucleoporins. Some nucleoporins form stable complexes [CNC, CFC (cytoplasmic filament nucleoporin complex), and CNT) and are drawn as units. (C) Cartoon of the experimental setup of (D) to (G). The CNC was preincubated with the IRC or Nup188 complex in the presence or absence of Nup145N. Complex formation was only observed in the presence of Nup145N. (D and E) The reconstitution of NPC symmetric core protomers containing the CNC hexamer and IRC is dependent on Nup145N. Identical experiments were performed in (D) the presence or (E) the absence of Nup145N. Size-exclusion chromatography (SEC) coupled to MALS profiles of the complexes in isolation (red and blue) and after preincubation (green) are shown. Colored arrows above the chromatogram indicate the resolved peak fractions. Measured molecular masses are indicated for each peak. Representative Coomassie-stained SDS-PAGE gel slices for the peak fractions are shown in the center. Cartoons below the gel slices illustrate the respective complexes. (F and G) The reconstitution of NPC symmetric core protomers containing the CNC hexamer and Nup188 complex is dependent on Nup145N. Identical experiments were performed in (F) the presence or (G) the absence of Nup145N. Complete SDS-PAGE gels for all panels are shown in fig. S4.

Docked Structures (Pymol Session) - Warning: very large file.
PDB coordinates (link to PDB site): 5HAX (Nup170NTD•Nup53R3), 5HAY (Nup170CTD), 5HAZ (Nup170CTD),
5HB0 (Nup170CTD•Nup145NR3), 5HB1 (Nup170SOL), 5HB2 (Nic96SOL), 5HB3 (Nic96SOL•Nup53R2),
5HB4 (Nup192ΔHEAD), 5HB5 (Nup145NAPD), 5HB6 (Nup145NAPD•Nup145CN ),
5HB7 (Nup53RRM, space group P212121), and 5HB8 (Nup53RRM, space group P3121)
PDBCoordinates: (.pdb): Nup170NTD•Nup53R3 (5HAX), Nup170CTD (5HAY), Nup170CTD (5HAZ), Nup170CTD•Nup145NR3 (5HB0), Nup170SOL (5HB1), Nic96SOL (5HB2), Nic96SOL•Nup53R2 (5HB3), Nup192ΔHEAD (5HB4), Nup145NAPD (5HB5), Nup145NAPD•Nup145CN (5HB6), Nup53RRM, space group P212121 (5HB7), and Nup53RRM, space group P3121 (5HB8)
Structure Factors: (.txt): Nup170NTD•Nup53R3 (5HAX), Nup170CTD (5HAY), Nup170CTD (5HAZ), Nup170CTD•Nup145NR3 (5HB0), Nup170SOL (5HB1), Nic96SOL (5HB2), Nic96SOL•Nup53R2 (5HB3), Nup192ΔHEAD (5HB4), Nup145NAPD (5HB5), Nup145NAPD•Nup145CN (5HB6), Nup53RRM, space group P212121 (5HB7), and Nup53RRM, space group P3121 (5HB8)
Coordinates:
Abstract:
The nuclear pore complex (NPC) controls the transport of macromolecules between the nucleus and cytoplasm, but its molecular architecture has thus far remained poorly defined. We biochemically reconstituted NPC core protomers and elucidated the underlying protein-protein interaction network. Flexible linker sequences, rather than interactions between the structured core scaffold nucleoporins, mediate the assembly of the inner ring complex and its attachment to the NPC coat. X-ray crystallographic analysis of these scaffold nucleoporins revealed the molecular details of their interactions with the flexible linker sequences and enabled construction of full-length atomic structures. By docking these structures into the cryoelectron tomographic reconstruction of the intact human NPC and validating their placement with our nucleoporin interactome, we built a composite structure of the NPC symmetric core that contains ~320,000 residues and accounts for ~56 megadaltons of the NPC’s structured mass. Our approach provides a paradigm for the structure determination of similarly complex macromolecular assemblies.
California Institute of Technology
Division of Chemistry & Chemical Engineering
1200 E. California Blvd.
Pasadena, CA 91125-7200
© Copyright Hoelz Laboratory

Architecture of the symmetric core of the nuclear pore
Lin, D.H.,# Stuwe, T.,# Schilbach, S., Rundlet, E.J., Perriches, T., Mobbs, G., Fan, Y., Thierbach, K., Huber, F.M., Collins, L.N., Davenport, A.M., Jeon, Y.E., Hoelz, A.*
(2016). Science, 352, 308
Figures from the paper:


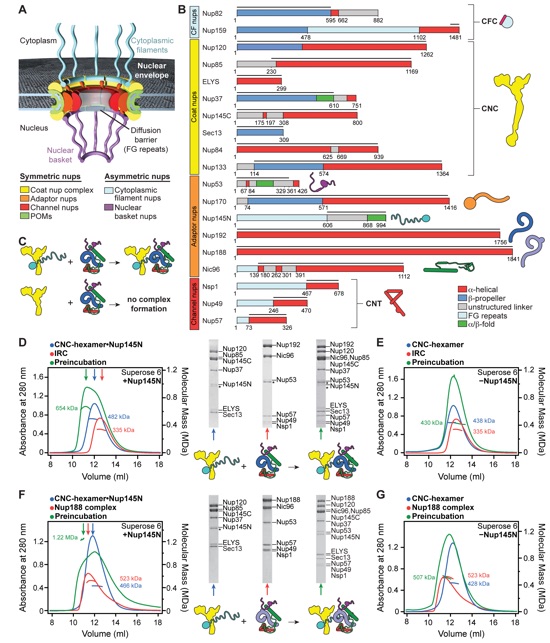
Fig. 2. Biochemical analysis of the interactions mediating NPC symmetric core assembly. (A) Scaffold domains of Nup192, Nup188, Nup170, and Nic96SOL do not interact with each other. SEC-MALS profiles of the individual scaffolds alone (blue, purple, orange, and green) and after their preincubation with each other (black) are shown. Measured molecular masses are indicated for each peak. (B and C) Linker nucleoporins Nup53 and Nup145N mediate scaffold nucleoporin assembly. SEC-MALS profiles of a scaffold nucleoporin mixture (blue or purple), a linker nucleoporin mixture (red), and these complexes after their preincubation with each other (black) are shown. Mixtures of scaffold nucleoporins contained either (B) Nup192 or (C) Nup188. Complete SDS-PAGE gels for all chromatograms are shown in fig. S7. (D and E) Interaction network between scaffold nucleoporins and (D) Nup53 or (E) Nup145N. Scaffold nucleoporins were tested in SEC-MALS interaction experiments for their ability to form heterodimeric complexes with Nup53 or Nup145N and their compatibility for also forming heterotrimeric complexes. Check marks indicate complexes that can form in SEC-MALS experiments, x’s indicate complexes that do not form, and dashes indicate complexes that were not tested. Complete SEC-MALS chromatograms and SDS-PAGE gels are shown in figs. S8 to S11. (F) Biochemical interaction map determined from SEC-MALS interaction experiments. Minimal regions of Nup145N and Nup53 sufficient for binding to components of the NPC are depicted by colored bars and dashed lines between interacting regions. Interactions that map to the same regions on Nup145N and Nup53 do not occur simultaneously. Complete SEC-MALS chromatograms and SDS-PAGE gels are shown in figs. S13 to S20. The nucleoporin cartoons are according to Fig. 1B.
Fig. 4. Structural analysis of the IRC nucleoporins Nic96 and Nup192. (A) Domain structures of Nic96 and Nup53. Black lines indicate fragments used for crystallization. (B) Cartoons of the crystal structures of apo Nic96SOL (yellow), the Nic96SOL•Nup53R2 complex (green and purple), and their superposition (see also Movie 3). (C) Close-up view of the Nup53R2-binding site in Nic96SOL. For clarity, Nup53 is shown in ribbon representation. Nic96 and Nup53 residues involved in the interaction are labeled in green and purple, respectively. (D) Close-up view of the superposition of apo and Nup53-bound structures of Nic96SOL, revealing minimal conformational changes. (E) Domain structure of Nup192. The black line indicates the fragment used for crystallization. (F) Cartoon of the crystal structure of Nup192∆HEAD. A 180°- rotated view is shown on the right. Regions of Nup192 that were resolved in previous crystal structures are colored in shades of blue; the region of the protein that was not included in previous crystallographic analyses is shaded cyan. (G) Cartoon of the structure of full-length Nup192, generated by superposing fragment crystal structures (see also fig. S31 and Movie 4).
Fig. 3. Structural and biochemical analyses of the Nup170 interaction network. (A) Domain structures of Nup170 and Nup53. Black lines indicate fragments used for crystallization. (B) Cartoon of the crystal structure of the Nup170NTD•Nup53R3 complex. A 90°-rotated view is shown on the right. The potential WF and ALPS membrane interaction motifs are indicated. (C) Close-up view of the interaction between Nup170 and Nup53. Nup170 and Nup53 residues involved in the interaction are labeled in orange and purple, respectively. (D) Graphic summary of mutational analysis of the Nup170NTD-Nup53R3 interaction. Nup170 is shown in surface representation from the same view as in (C). Residues are colored in red, orange, yellow, or green to indicate mutations that had a strong, moderate, weak, or nonexistent effect on binding, respectively. (E) Tabular summary of tested Nup170 mutants and their effect on Nup53 binding. Three plus signs indicate wild-type binding, two plus signs indicate moderately weakened binding, one plus sign indicates weak binding, and a dash indicates no binding. Mutations in Nup53 that were tested for binding are indicated by dots above the sequence, following the same color code as in (D). Chromatograms and representative SDS-PAGE gels are shown in fig. S22. (F) Domain structures of Nup170 and Nup145N. Black lines indicate fragments used for crystallization. (G) Cartoon of the crystal structure of the Nup170CTD•Nup145NR3 complex. (H) Close-up view of the interaction between Nup170 and Nup145N. Nup170 and Nup145N residues involved in the interaction are labeled in orange and cyan, respectively. (I) Graphic summary of mutational analysis of the Nup170CTD-Nup145NR3 interaction. Nup170 is shown in surface representation from the same view as in (H). Coloring is according to (D). (J) Tabular summary of mutational analysis of the Nup170CTD-Nup145NR3 interaction, with the same symbols and coloring as in (E). Chromatograms and representative SDS-PAGE gels are shown in fig. S23. Single-letter abbreviations for the amino acid residues are as follows: A, Ala; C, Cys; D, Asp; E, Glu; F, Phe; G, Gly; H, His; I, Ile; K, Lys; L, Leu; M, Met; N, Asn; P, Pro; Q, Gln; R, Arg; S, Ser; T, Thr; V, Val; W, Trp; and Y, Tyr
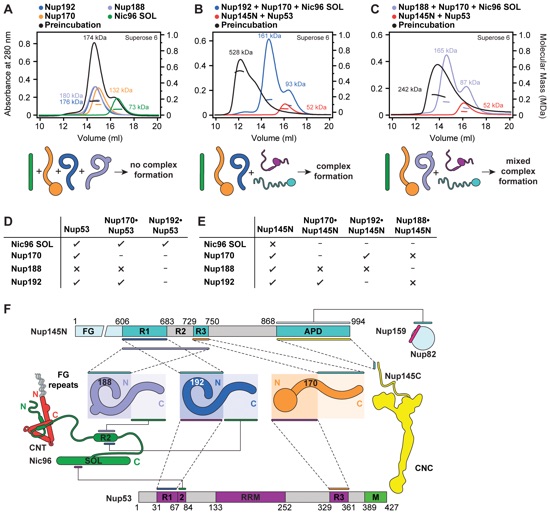
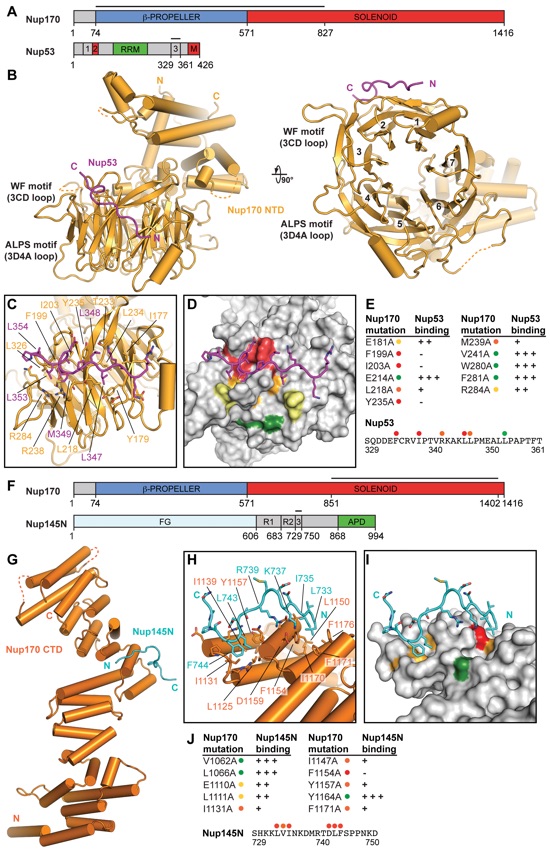
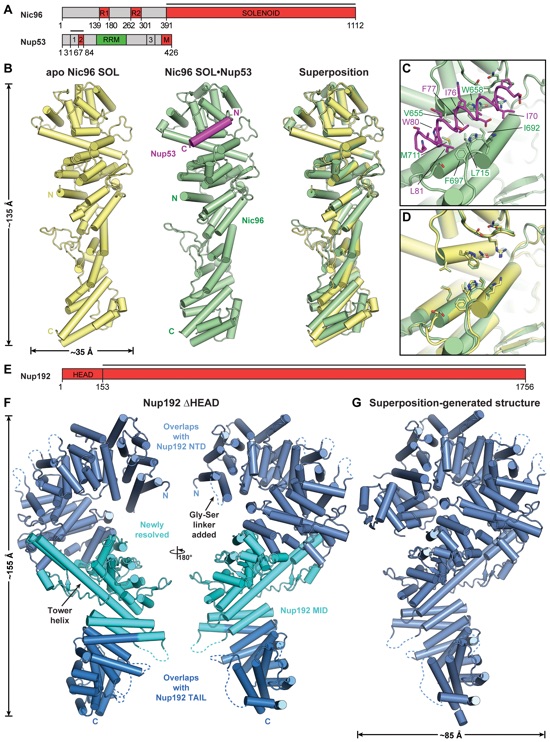
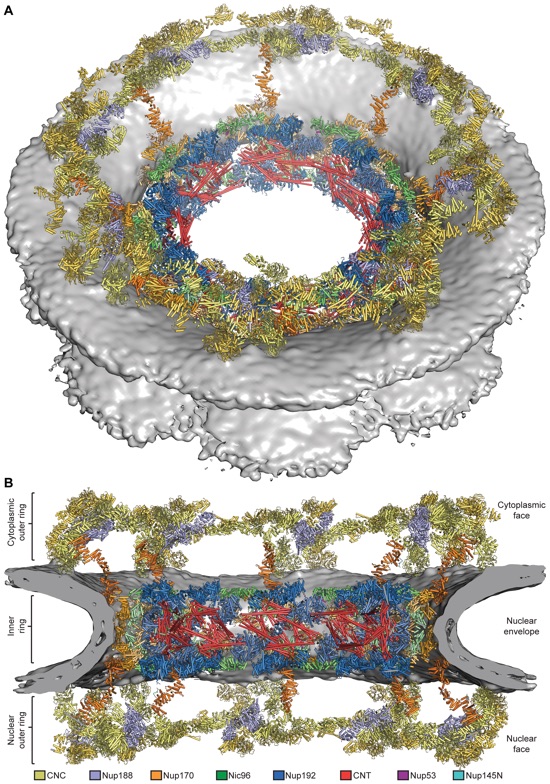
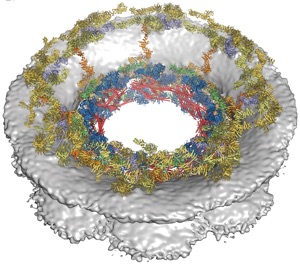
Fig. 5. Architecture of the NPC symmetric core. The composite structure of the NPC symmetric core was generated by docking nucleoporin and nucleoporin complex crystal structures into the cryo-ET reconstruction of the intact human NPC (Electron Microscopy Data Bank entry number EMD-3103). The density corresponding to the nuclear envelope is shown as a gray surface. Proteins are color-coded according to the legend at the bottom. (A) View from above the cytoplasmic face and (B) a cross-sectional view from within the transport channel (see also figs. S34 to S37 and S40 and Movie 5).
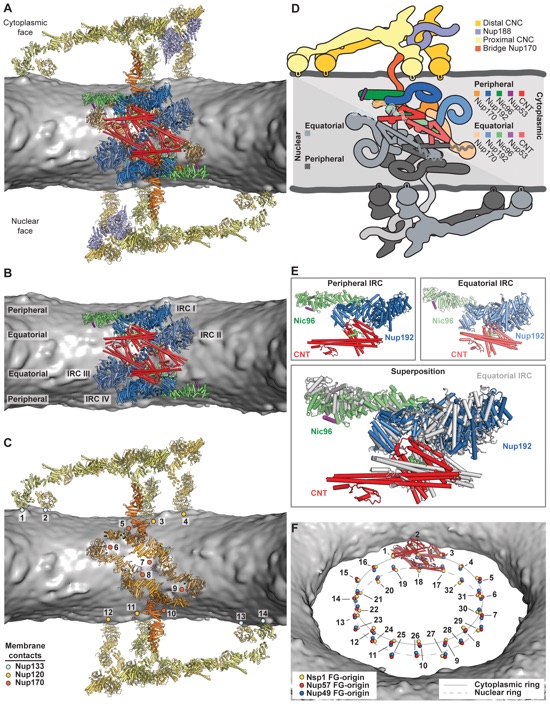
Fig. 6. Architecture of the NPC spoke. (A) A cartoon of a single spoke of the NPC symmetric core is shown from the same cross-sectional view as in Fig. 5B. Different shades of colors are used to indicate biochemically distinct dockings of the same protein (see also Movie 6). (B) The same view as in (A), but with Nup170 and the nucleoporins from the outer ring removed to highlight the organization of the four IRCs. (C) The membrane coat of the NPC. Nup192 and Nic96 molecules and CNTs have been removed for clarity. Contacts between the nuclear envelope and the ALPS motifs in Nup120, Nup133, and Nup170 are indicated by dots (numbered as a guide to the eye). (D) Schematic of the NPC spoke. The proteins corresponding to the nuclear side of the spoke are colored in gray, demonstrating the twofold rotational symmetry relating the cytoplasmic and nuclear halves of each spoke. (E) Equatorial and peripheral IRCs adopt similar conformations. Identical views of the cytoplasmic peripheral IRC, the cytoplasmic equatorial IRCs, and their superposition are shown. For clarity, the equatorial IRC is colored in gray in the superposition. (F) Organization of FG repeats in the inner ring. Colored spheres indicate the positions of the N termini of the three channel nucleoporins for all 32 CNT copies in the inner ring. Despite four distinct CNT positions in each spoke, the N termini for the cytoplasmic and nuclear complexes are arranged in approximately the same plane. Thus, though not possessing true 16-fold symmetry, the CNT N termini approximately form two 16-membered rings, which are indicated by a solid and a dashed line. The FG repeats of the 16-membered CNT rings project circumferentially into the central transport channel with opposite directionality (cytoplasmic CNT ring, counterclockwise; nuclear CNT ring, clockwise). Cartoons of the CNT molecules for a single spoke are shown to indicate the directionality of the FG repeats.
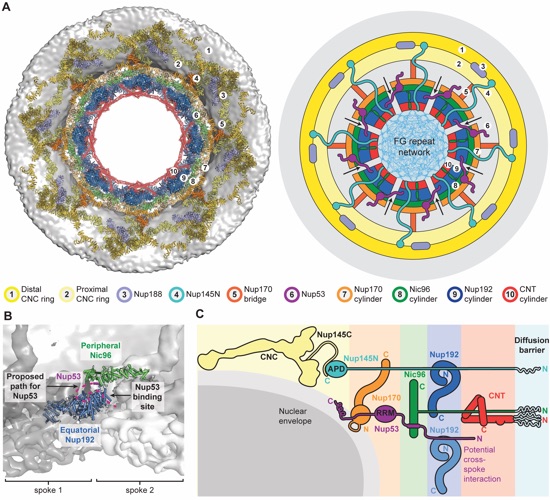
Fig. 7. Cylindrical organization of the NPC. (A) Top view of the composite structure of the NPC symmetric core, viewed from the cytoplasm (left). Coloring is according to Fig. 5. The schematic representation on the right illustrates the distinct concentric cylinders observed in the symmetric core. Cartoons of the linker nucleoporins and the unstructured NTE of Nic96 are shown to indicate how they span across multiple cylinders. Arrows indicate gaps between the inner ring spokes, which represent proposed paths for inner nuclear membrane protein transport. (B) Only a single contact is observed between two adjacent inner ring spokes. A close-up view of the inter-spoke interface in the inner ring is shown in an orientation similar to Fig. 5A. The two adjacent spokes are depicted as gray and white surfaces on the left and right, respectively. An equatorial Nup192 molecule (spoke 1) and a peripheral Nic96 molecule bound to Nup53 (spoke 2) are shown as cartoons. The Nup53-binding site on Nup192 is labeled, and the proposed path of the peptide is drawn as a purple dashed line. (C) Schematic illustrating the concentric cylinder organization of the symmetric core, viewed from the side. The order and arrangement of the binding sites for the linker nucleoporins observed in the composite structure are depicted. The proposed inter-spoke interaction between Nup53 and Nup192 is drawn at the bottom.
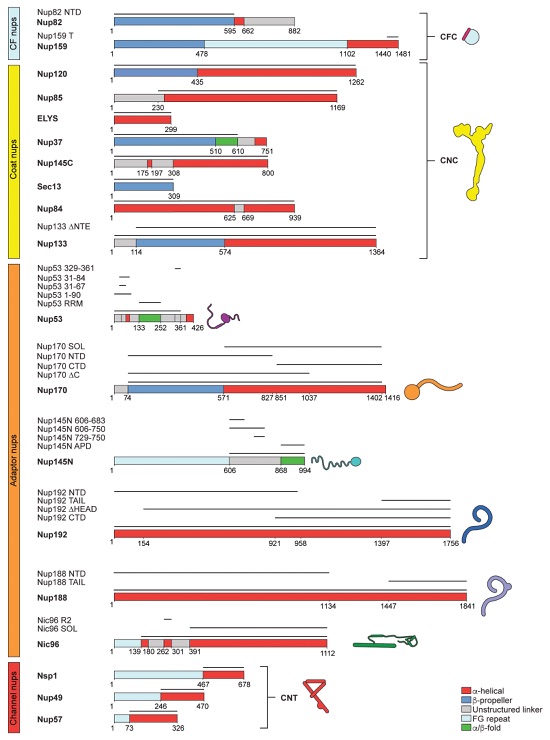
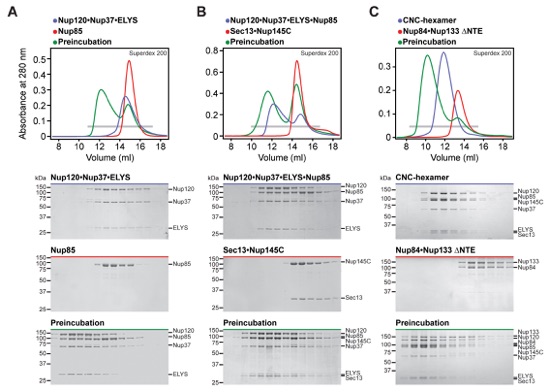
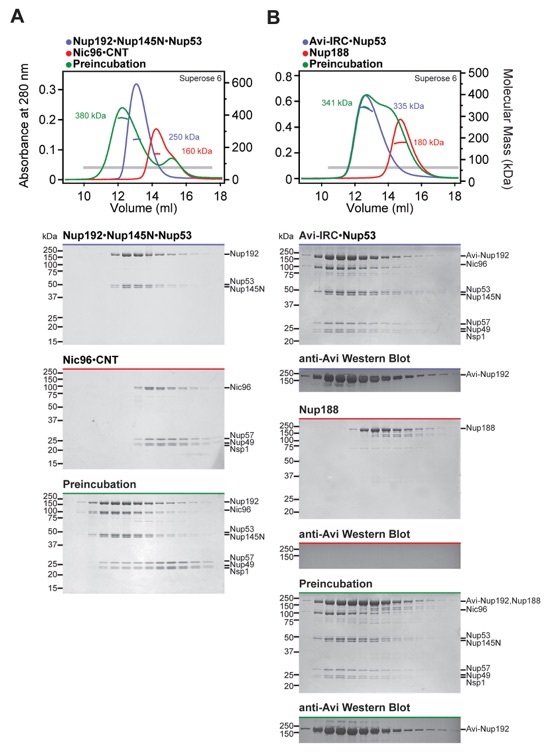

Fig.S1. Nucleoporin fragments. Domain boundaries of all nucleoporin fragments used throughout the text are indicated by black lines.
Fig. S2. Reconstitution of the CNC. SEC and SDS-PAGE analysis for the reconstitution of (A) the Nup120•Nup37•ELYS•Nup85 hetero-tetramer, (B) the CNC-hexamer, and (C) the CNC-octamer. SEC profiles of nucleoporins or nucleoporin complexes are shown individually (blue and red) and after their preincubation (green). All SEC profiles were obtained using a Superdex 10/300 GL column. Gray bars indicate fractions that were resolved on SDS-PAGE gels and visualized by Coomassie staining. The CNC-octamer could only be reconstituted with a Nup133 construct lacking the NTE.
Fig. S3. Reconstitution of the IRC•Nup53 complex. SEC-MALS and SDS-PAGE analysis of (A) the reconstitution of the IRC•Nup53 hetero-heptamer and (B) the interaction of IRC•Nup53 with Nup188. SEC-MALS profiles of nucleoporins or nucleoporin complexes are shown individually (blue and red) and after their preincubation (green). All SEC profiles were obtained using a Superose 6 10/300 GL column. Measured molecular masses are indicated for the peak fractions. Gray bars indicate fractions that were resolved on SDS-PAGE gels and visualized by Coomassie staining or by immunoblotting with a mouse anti-AviTag antibody. As Nup188 and Nup192 cannot be distinguished by SDS-PAGE analysis, lack of Nup192 displacement from the IRC by Nup188 was confirmed by western blotting against Avi-tagged Nup192.
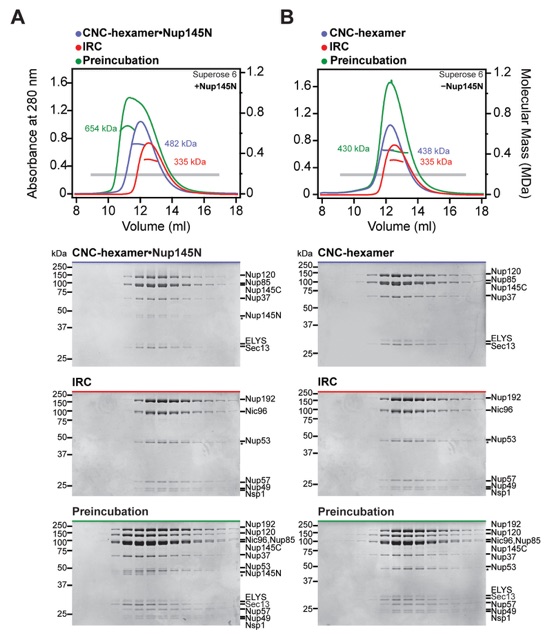
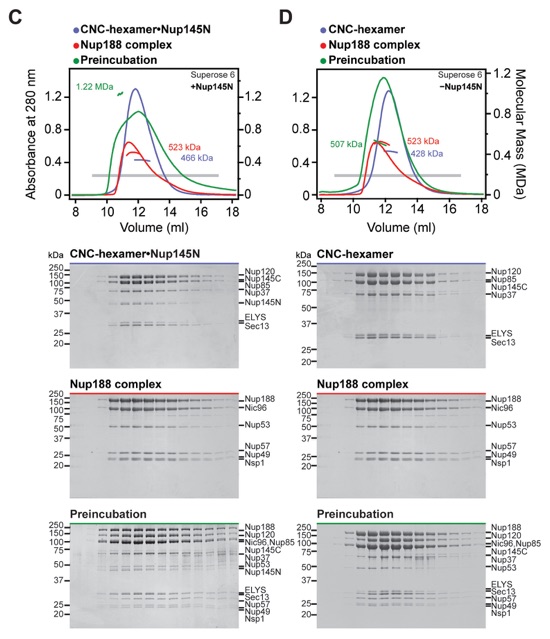
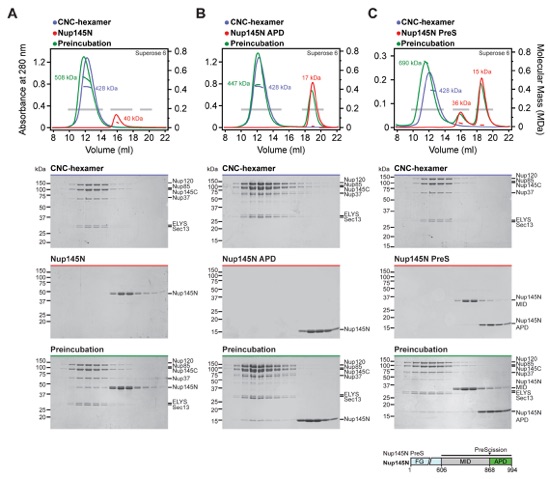
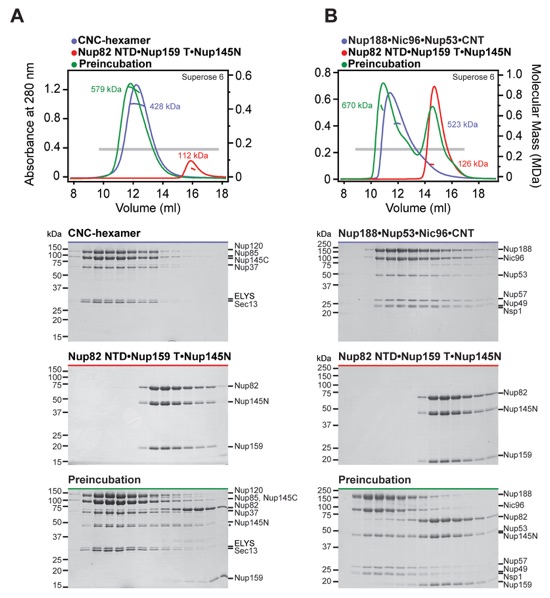
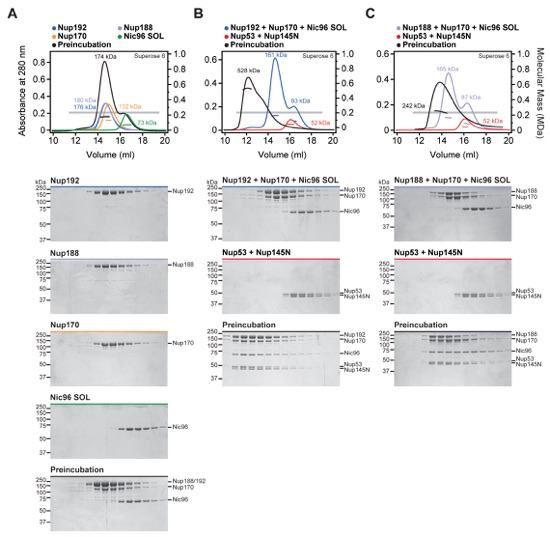
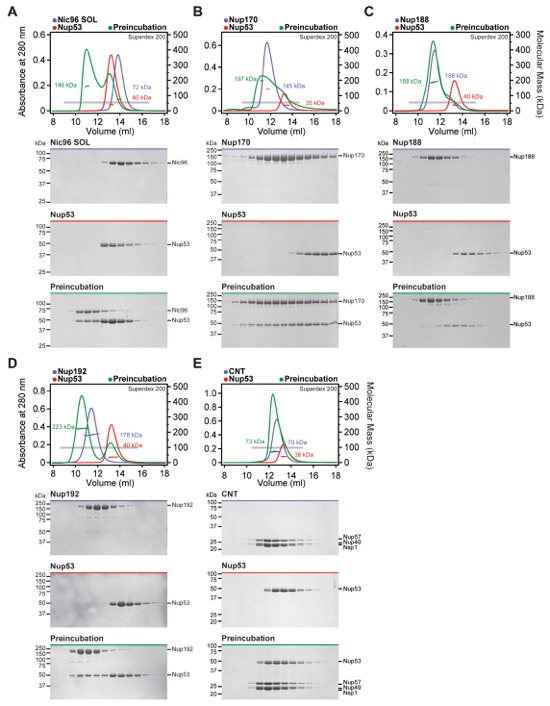
Fig. S4. Reconstitution of NPC core protomers. (A-D) SEC-MALS and SDS-PAGE analysis corresponding to Fig. 1, D to G. SEC-MALS profiles of nucleoporin complexes are shown individually (blue and red) and after their preincubation (green). All SEC profiles were obtained using a Superose 6 10/300 GL column. Measured molecular masses are indicated for the peak fractions. Gray bars indicate fractions that were resolved on SDS-PAGE gels and visualized by Coomassie staining.
Fig. S5. The CNC-hexamer interacts with Nup145NAPD. SEC-MALS and SDS-PAGE analysis of the CNC-hexamer interaction with (A) Nup145N, (B) Nup145NAPD, and (C) Nup145N PreS preincubated with PreScission protease. SEC-MALS profiles of nucleoporins or nucleoporin complexes are shown individually (blue and red) and after their preincubation (green). All SEC profiles were obtained using a Superose 6 10/300 GL column. Measured molecular masses are indicated for the peak fractions. Gray bars indicate fractions that were resolved on SDS-PAGE gels and visualized by Coomassie staining. As reference, the domain structure of Nup145N PreS is shown, indicating the construct boundaries and PreScission cleavage site with a black bar and a black triangle, respectively. After cleavage with PreScission protease, Nup145NAPD co-elutes with the CNC-hexamer, whereas Nup145NMID does not incorporate into the complex.
Fig. S6. Incorporation of Nup145N into complexes with CNC-hexamer or Nup188•Nic96•Nup53•CNT is exclusive of Nup145N binding to Nup82NTD•Nup159T. SEC-MALS and SDS-PAGE analysis of the CFC interaction with (A) the CNC-hexamer or (B) the Nup188•Nic96•Nup53•CNT complex. SEC-MALS profiles of nucleoporin complexes are shown individually (blue and red) and after their preincubation (green). SEC profiles were obtained using a Superose 6 10/300 GL column. Measured molecular masses are indicated for the peak fractions. Gray bars indicate fractions that were resolved on SDS-PAGE gels and visualized by Coomassie staining. In both preincubations, Nup145N incorporates stoichiometrically into the complexes, but the Nup82NTD•Nup159T hetero-dimer does not. However, Nup82NTD•Nup159T interacts weakly with the Nup188-containing complex.
Fig. S8. Identification of interactions between Nup53 and the scaffold nucleoporins. (A-E) SEC-MALS and SDS-PAGE analysis for Fig. 2D. SEC-MALS profiles of nucleoporins are shown individually (blue and red) and after their preincubation (green). All SEC profiles were obtained using a Superdex 200 10/300 GL column. Measured molecular masses are indicated for the peak fractions. Gray bars indicate fractions that were resolved on SDS-PAGE gels and visualized by Coomassie staining. Robust complex formation with Nup53 was observed for (A) Nic96SOL, (B) Nup170, and (D) Nup192. Interactions of Nup53 with (C) Nup188 and (E) the CNT were only barely detectable.
Fig. S7. Scaffold nucleoporins are assembled by the linker nucleoporins. SEC-MALS and SDS-PAGE analysis corresponding to Fig. 2, A to C. (A) For interaction analysis between scaffold nucleoporins, SEC-MALS profiles of nucleoporins are shown individually (blue, purple, orange, or green) and after their preincubation (black). (B) To analyze the assembly of Nup192, Nup170, and Nic96SOL with the linker nucleoporins Nup53 and Nup145N, SEC-MALS profiles of the scaffold mixture (blue), the linker mixture (red), or after their preincubation (black) are shown. (C) To analyze the assembly of Nup188, Nup170 and Nic96SOL with the linker nucleoporins Nup53 and Nup145N, SEC-MALS profiles of the scaffold mixture (purple), the linker mixture (red), or after their preincubation (black) are shown. All SEC profiles were obtained using a Superose 6 10/300 GL column. Measured molecular masses are indicated for the peak fractions. Gray bars indicate fractions that were resolved on SDS-PAGE gels and visualized by Coomassie staining. Because Nup188 could not be incorporated into the IRC, Nup188 and Nup192 were not simultaneously included in preincubations.
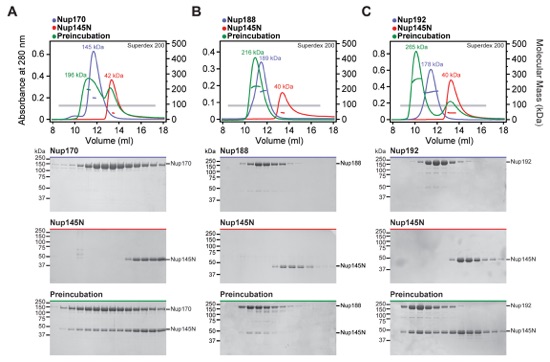
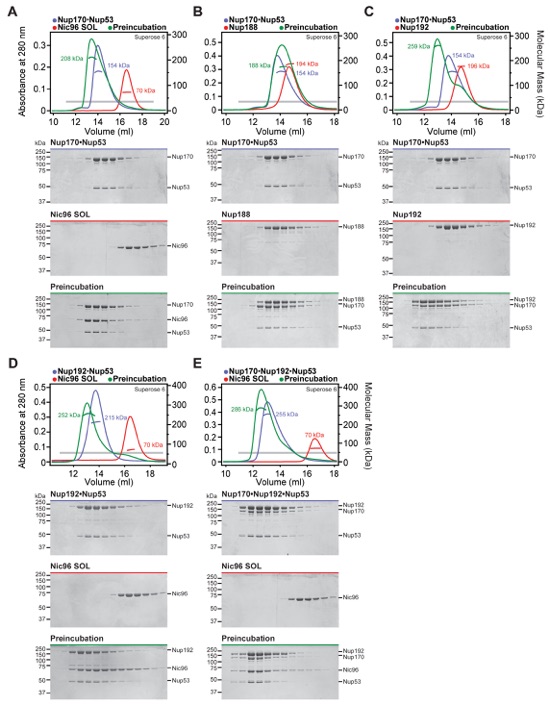
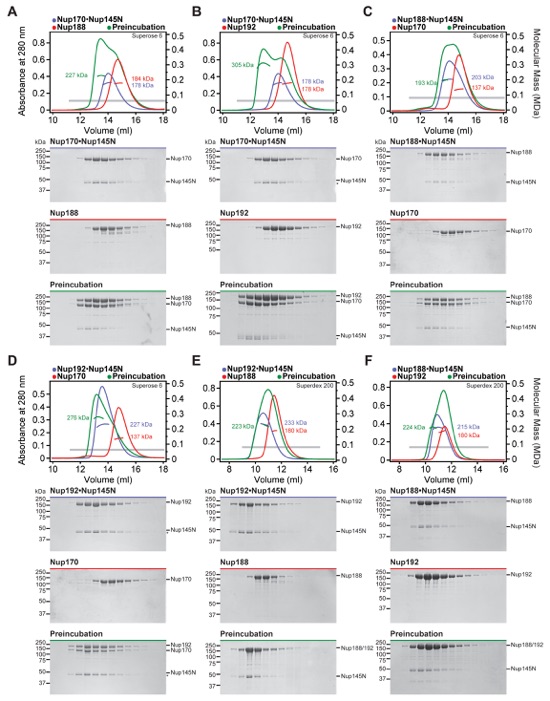
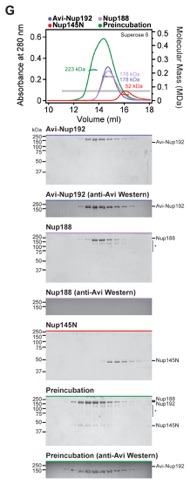
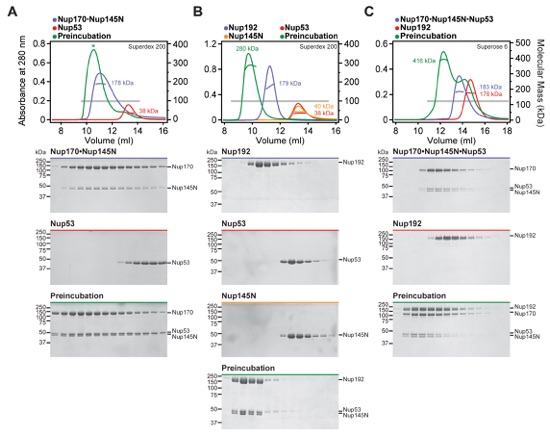
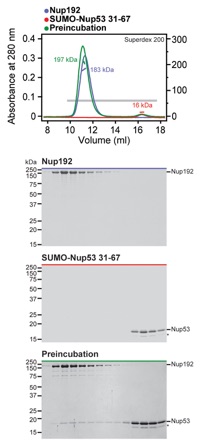
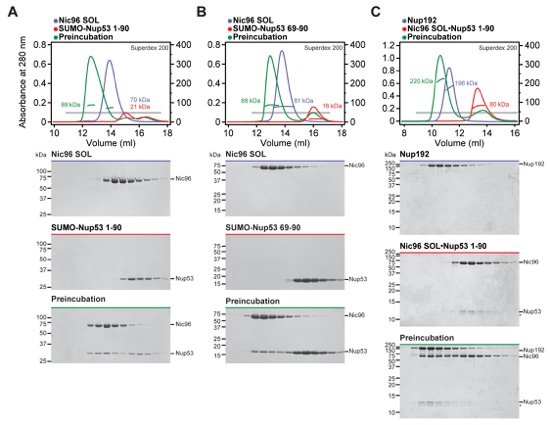
Fig. S9. Identification of interactions between Nup145N and scaffold nucleoporins. (A-C) SEC-MALS and SDS-PAGE analysis for Fig. 2E. SEC-MALS profiles of nucleoporins are shown individually (blue and red) and after their preincubation (green). All SEC profiles were obtained using a Superdex 200 10/300 GL column. Measured molecular masses are indicated for the peak fractions. Gray bars indicate fractions that were resolved on SDS-PAGE gels and visualized by Coomassie staining. Robust complex formation with Nup145N was observed for (A) Nup170, (B) Nup188, and (C) Nup192. We previously demonstrated interactions between Nup145N and Nic96 and the CNT (15).
Fig. S10. Identification of hetero-trimeric complexes assembled by Nup53. (A-E) SEC-MALS and SDS-PAGE analysis corresponding to Fig. 2D. Purified hetero-dimeric Nup53 complexes were tested for their ability to form hetero-trimers with an additional scaffold nucleoporin. SEC-MALS profiles of nucleoporins or nucleoporin complexes are shown individually (blue and red) and after their preincubation (green). All SEC profiles were obtained using a Superose 6 10/300 GL column. Measured molecular masses are indicated for the peak fractions. Gray bars indicate fractions that were resolved on SDS-PAGE gels and visualized by Coomassie staining. (A, C-E) Nup53 is able to bind simultaneously to Nup170, Nic96SOL, and Nup192. (B) The interaction of Nup188 with the Nup170•Nup53 hetero-dimer was only barely detectable.
Fig. S11. Identification of hetero-trimeric complexes assembled by Nup145N. (A-G) SEC-MALS and SDS-PAGE analysis corresponding to Fig. 2E. Purified hetero-dimeric Nup145N complexes were tested for their ability to form hetero-trimers with an additional scaffold nucleoporin. SEC-MALS profiles of nucleoporins or nucleoporin complexes are shown individually (blue, red, and purple) and after their preincubation (green). SEC profiles were obtained using either a Superose 6 10/300 GL column or a Superdex 200 10/300 GL column as indicated. Measured molecular masses are indicated for the peak fractions. Gray bars indicate fractions that were resolved on SDS-PAGE gels and visualized by Coomassie staining or by western blot analysis with a mouse anti-AviTag antibody. Hetero-trimeric complex formation was determined on the basis of a shift in elution volume, an increase in measured molecular mass, and the presence of all three proteins in the higher molecular mass fractions. For preincubations with (A, E) Nup188 or (C, F) Nup188•Nup145N, only minor shifts in elution volume and no increases in the measured molecular masses were observed, indicating the formation of a mixture of species rather than stable hetero-trimeric complexes as seen between (B, D) Nup170, Nup192, and Nup145N. (G) As Nup188 and Nup192 cannot be distinguished by SDS-PAGE, western blot analysis was employed to confirm that Nup188 and Nup192 bind to Nup145N in a mutually exclusive fashion.
Fig. S12. Binding sites for linker nucleoporins on Nup170 and Nup192 are distinct and compatible. (A-C) SEC-MALS profiles of nucleoporins or nucleoporin complexes are shown individually (blue, red, or yellow) and after their preincubation (green). SEC profiles were obtained using a Superdex 200 10/300 GL column for panels (A, B) and a Superose 6 10/300 GL column for panel (C). Measured molecular masses are indicated for the peak fractions. Gray bars indicate fractions that were resolved on SDS-PAGE gels and visualized by Coomassie staining. We were unable to obtain an accurate molecular mass measurement for the preincubation of Nup53 with Nup170•Nup145N, as indicated by an asterisk above the chromatogram.
Fig. S13. Nup192 recognizes Nup5331-67. SEC-MALS and SDS-PAGE analysis corresponding to Fig. 2F. SEC-MALS profiles of nucleoporins are shown individually (blue and red) and after their preincubation (green). All SEC profiles were obtained using a Superdex 200 10/300 GL column. Measured molecular masses are indicated for the peak fractions. Gray bars indicate fractions that were resolved on SDS-PAGE gels and visualized by Coomassie staining.
Fig. S14. Nic96SOL recognizes Nup5369-90 and Nup531-90 binds simultaneously to Nup192 and Nic96SOL. (A-C) SEC-MALS and SDS-PAGE analysis corresponding to Fig. 2F. SEC-MALS profiles of nucleoporins or nucleoporin complexes are shown individually (blue and red) and after their preincubation (green). All SEC profiles were obtained using a Superdex 200 10/300 GL column. Measured molecular masses are indicated for the peak fractions. Gray bars indicate fractions that were resolved on SDS-PAGE gels and visualized by Coomassie staining. The Nup53 binding sites for (A, B) Nic96SOL and Nup192 map to directly adjacent sequence fragments and (C) are not mutually exclusive.
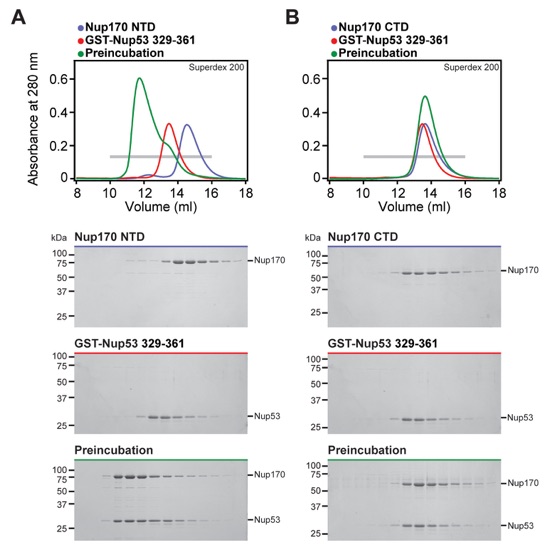
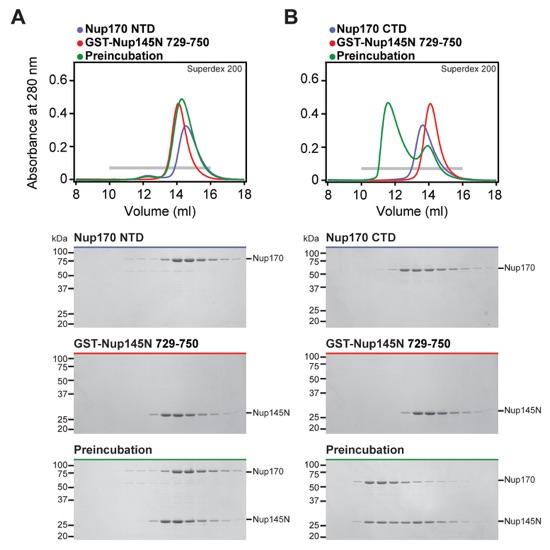
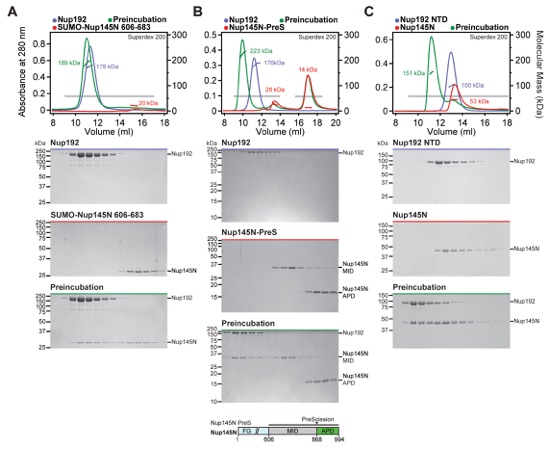
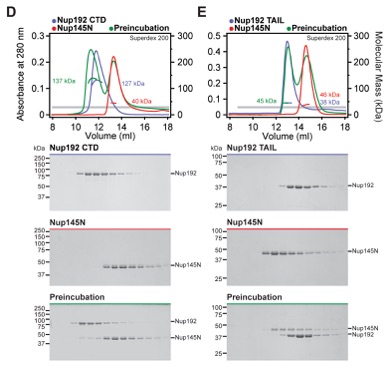
Fig. S15. Nup170NTD recognizes Nup53329-361. (A, B) SEC and SDS-PAGE analysis corresponding to Fig. 2F. SEC profiles of nucleoporins are shown individually (blue and red) and after their preincubation (green). All SEC profiles were obtained using a Superdex 200 10/300 GL column. Gray bars indicate fractions that were resolved on SDS-PAGE gels and visualized by Coomassie staining.
Fig. S16. Nup170CTD recognizes Nup145N729-750. (A, B) SEC and SDS-PAGE analysis corresponding to Fig. 2F. SEC profiles of nucleoporins are shown individually (blue and red) and after their preincubation (green). All SEC profiles were obtained using a Superdex 200 10/300 GL column. Gray bars indicate fractions that were resolved on SDS-PAGE gels and visualized by Coomassie staining.
Fig. S17. Nup192 recognizes Nup145N606-683 primarily with its NTD. (A-E) SEC-MALS and SDS-PAGE analysis corresponding to Fig. 2F. SEC-MALS profiles of nucleoporins are shown individually (blue and red) and after their preincubation (green). All SEC profiles were obtained using a Superdex 200 10/300 GL column. Measured molecular masses are indicated for the peak fractions. Gray bars indicate fractions that were resolved on SDS-PAGE gels and visualized by Coomassie staining. (A) Nup192 binds to a minimal sequence on Nup145N between residues 606-683. (B) After cleavage of Nup145NPreS with PreScission protease, Nup145NMID co-elutes with Nup192, whereas Nup145NAPD does not interact with Nup192. As a reference, the domain structure of Nup145NPreS is shown, indicating the construct boundaries and PreScission cleavage site with a black bar and a black triangle, respectively. (C) Nup145N forms a stoichiometric complex with Nup192NTD, but Nup145N binding to (D) Nup192CTD and (E) Nup192TAIL were barely detectable and undetectable, respectively.
Fig. S18. Mapped minimal linker nucleoporin fragments are specific for the identified binding partners. (A-H) SEC-MALS profiles of nucleoporins are shown individually (blue and red) and after their preincubation (green). All SEC profiles were obtained using a Superdex 200 10/300 GL column. Measured molecular masses are indicated for the peak fractions. Gray bars indicate fractions that were resolved on SDS-PAGE gels and visualized by Coomassie staining. The minimal sequence fragments of the linker nucleoporins Nup53 and Nup145N did not interact with other scaffold nucleoporins, demonstrating their specificity for a single scaffold nucleoporin.
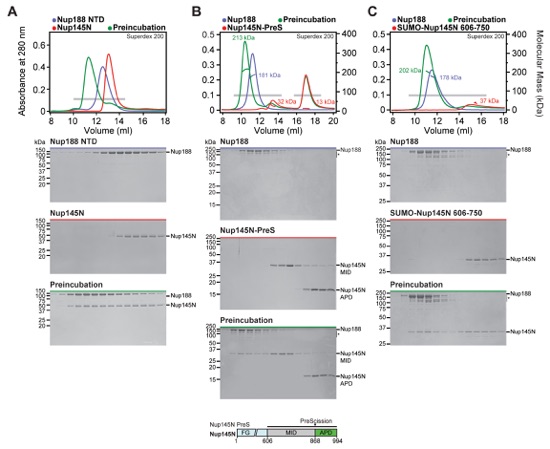
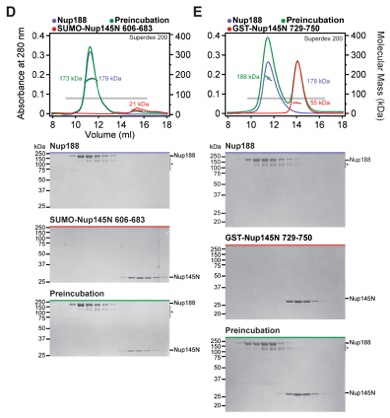
Fig. S19. Nup188 recognizes Nup145N606-750 primarily via its NTD. (A-E) SEC-MALS and SDS-PAGE analysis corresponding to Fig. 2F. SEC-MALS profiles of nucleoporins are shown individually (blue and red) and after their preincubation (green). All SEC profiles were obtained using a Superdex 200 10/300 GL column. Measured molecular masses are indicated for the peak fractions. Gray bars indicate fractions that were resolved on SDS-PAGE gels and visualized by Coomassie staining. (A) Nup188NTD is responsible for binding Nup145N. (B) After Nup145NPreS cleavage with PreScission protease, Nup145NMID co-elutes with Nup188, whereas Nup145NAPD does not interact with Nup188. As reference, the domain structure of Nup145NPreS is shown, indicating the construct boundaries and PreScission cleavage site with a black bar and a black triangle, respectively. (C) Nup188 binds to a minimal sequence on Nup145N between residues 606-750, but does not interact with the minimal Nup145N binding sequences for (D) Nup192 or (E) Nup170.
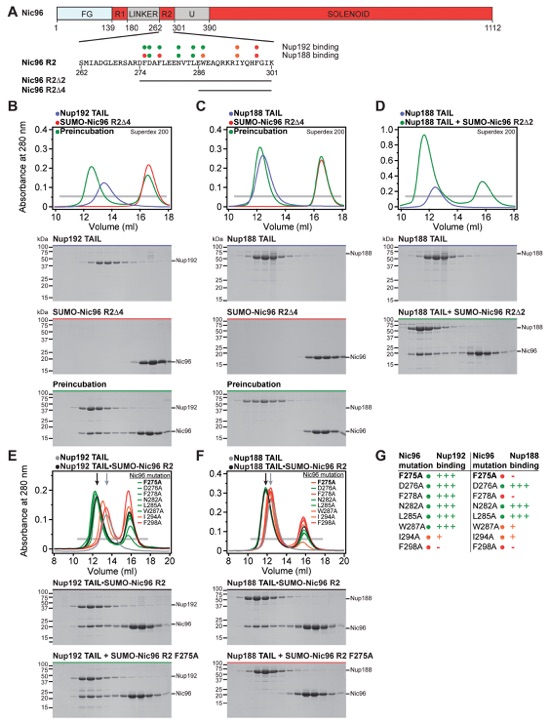
Fig. S20. Nup192TAIL and Nup188TAIL bind to partially overlapping sites in Nic96R2. (A) Domain boundaries of Nic96 with the protein sequence corresponding to the R2 region shown below. Black lines indicate construct boundaries for Nic96R2, Nic96R2∆2, and Nic96R2∆4. The effects of Nic96R2 alanine mutations on Nup192TAIL and Nup188TAIL binding are indicated by colored dots; no effect (green), reduced binding (orange), and complete disruption (red). (B-D) SEC and SDS-PAGE analysis corresponding to Fig. 2F. SEC profiles of nucleoporins are shown individually (blue and red) and after their preincubation (green). Nic96R2∆2 is insoluble when expressed alone and therefore was expressed and purified in the presence of Nup188TAIL. (E, F) Mutational analysis of the Nic96R2 interaction with Nup192TAIL and Nup188TAIL. SEC profiles of Nup192TAIL or Nup188TAIL are shown individually (gray) and after preincubation with wild type Nic96R2 (black) and are annotated with arrows of the same color. SEC profiles of mutant proteins preincubated with Nic96R2 are colored according to measured effect as in panel (A). All SEC profiles were obtained using a Superdex 200 10/300 GL column. Gray bars indicate fractions that were resolved on SDS-PAGE gels and visualized by Coomassie staining. (G) Table summarizing the measured effects of Nic96R2 mutation on Nup192TAIL and Nup188TAIL binding colored according to panel (A): no effect (+++), moderate effect (+), abolished binding (-). The Nic96R2 F275A mutant abolished binding to Nup188TAIL but not to Nup192TAIL.
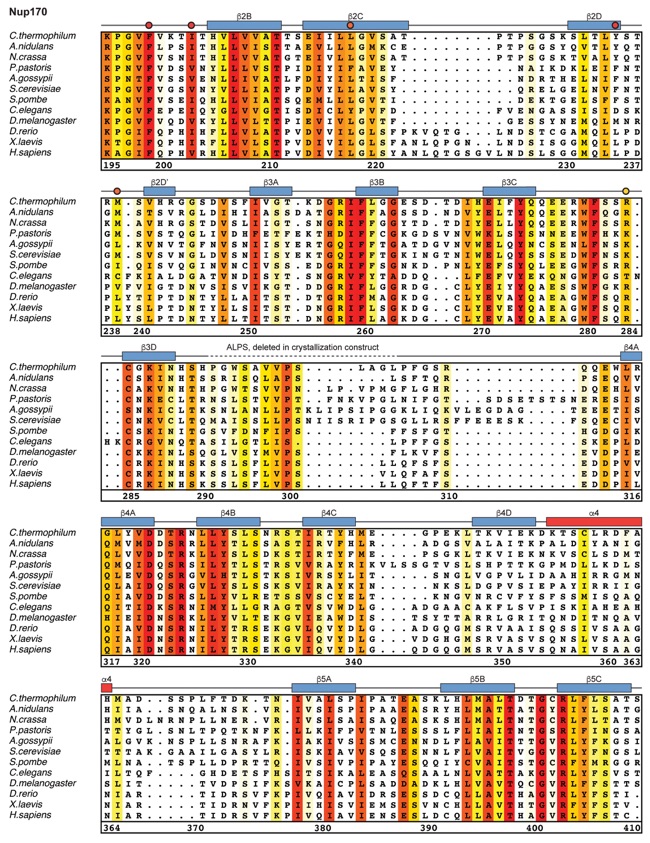
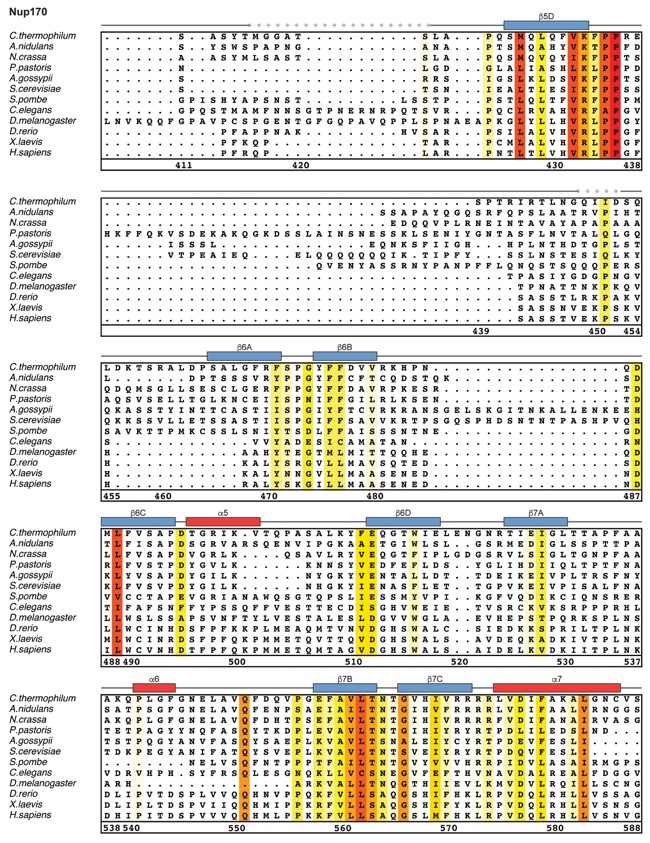
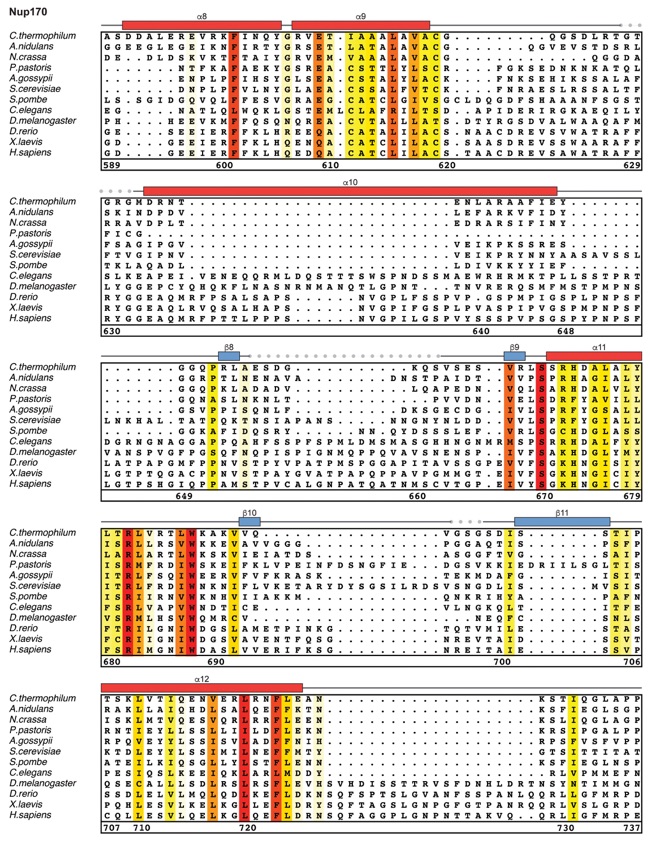
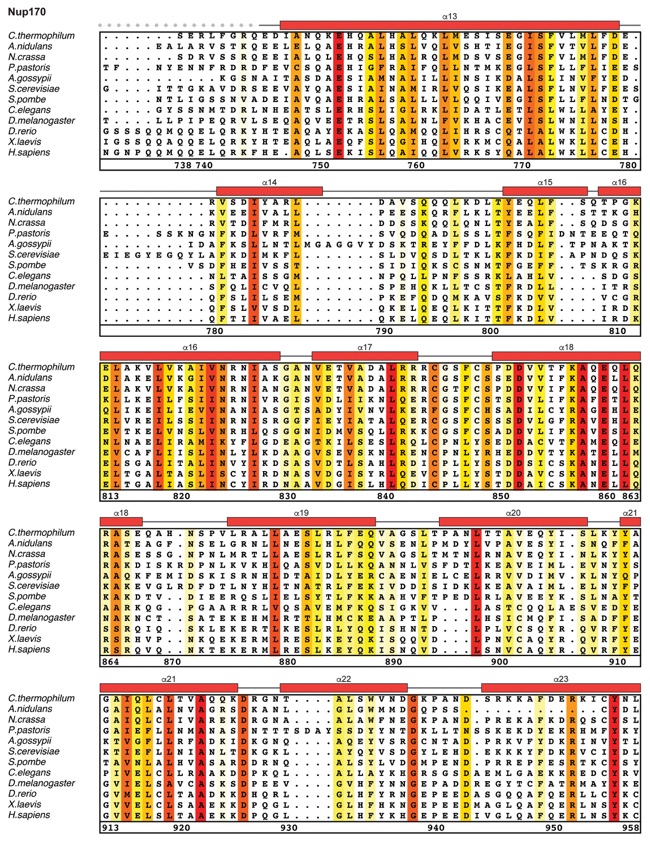
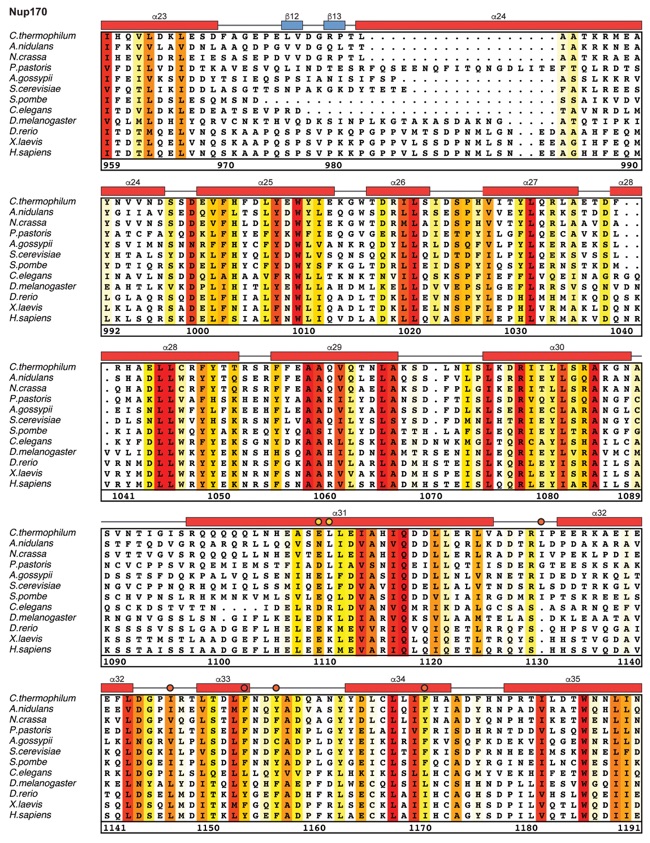
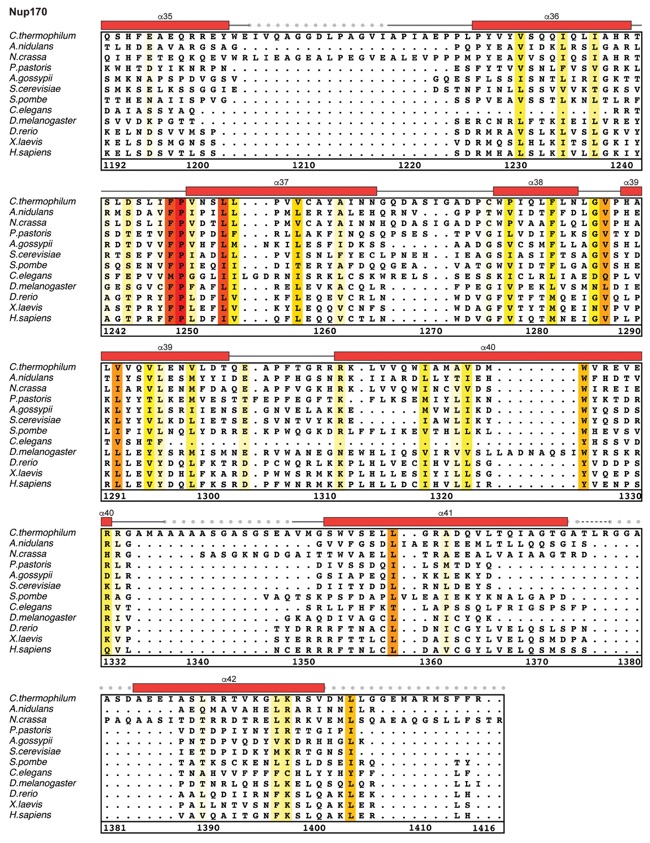
Fig. S21. Multispecies sequence alignment of Nup170. Sequences from twelve diverse species were aligned and colored by sequence similarity according to the BLOSUM62 matrix from white (less than 55 % similarity), to yellow (55 % similarity), to red (100 % identity). Numbering below alignment is relative to the C. thermophilum sequence. Secondary structure observed in the Nup170 structures is shown above the alignment: α-helices (red bars), β-sheets (blue bars), and unstructured regions (black lines). Mutations that affect Nup53 or Nup145N binding identified by a mutational analysis (Fig. 3; figs. S22; fig. S23) are indicated by circles above the alignment and colored according to the measured effect; weak effect (yellow), moderate effect (orange), abolished binding (red). Dashed lines indicate loops that were deleted in crystallization constructs. Disordered regions are indicated by gray dots.
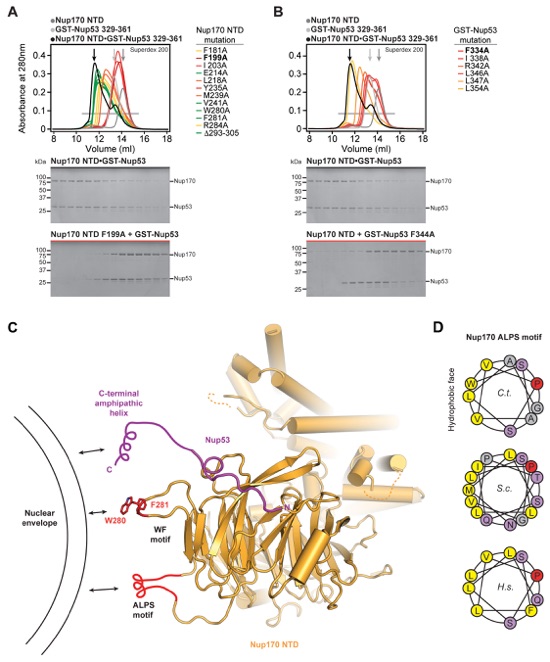
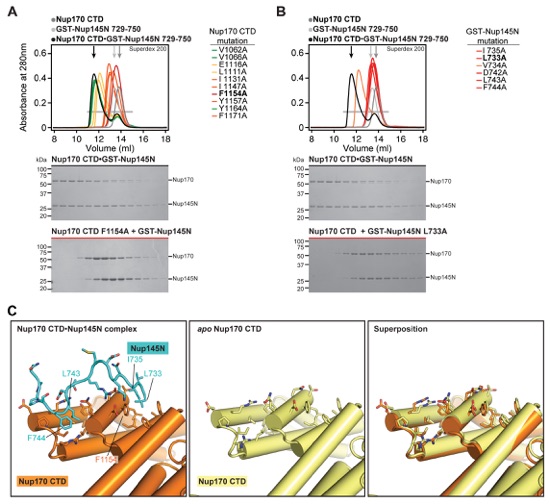
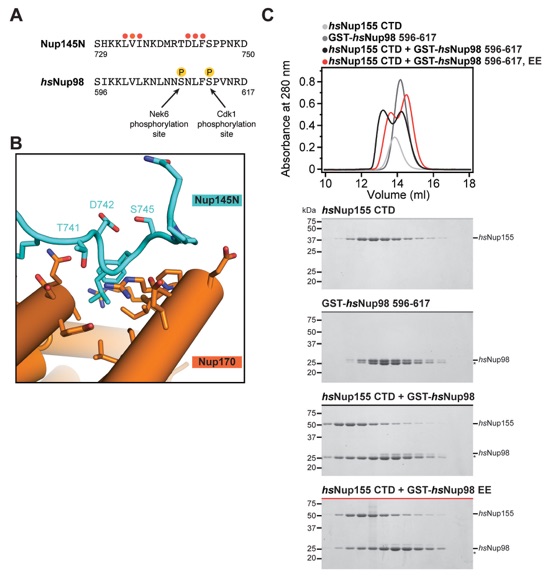
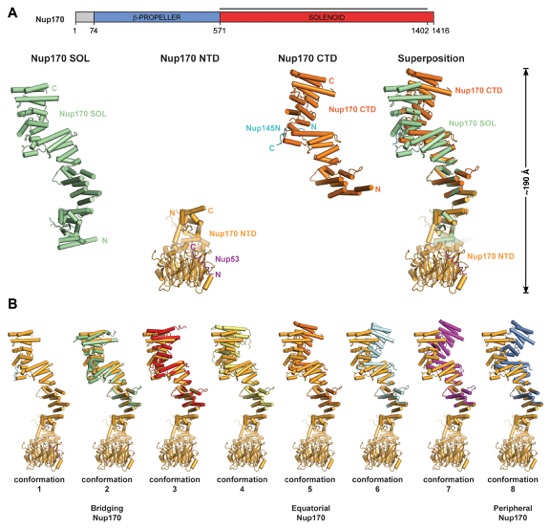
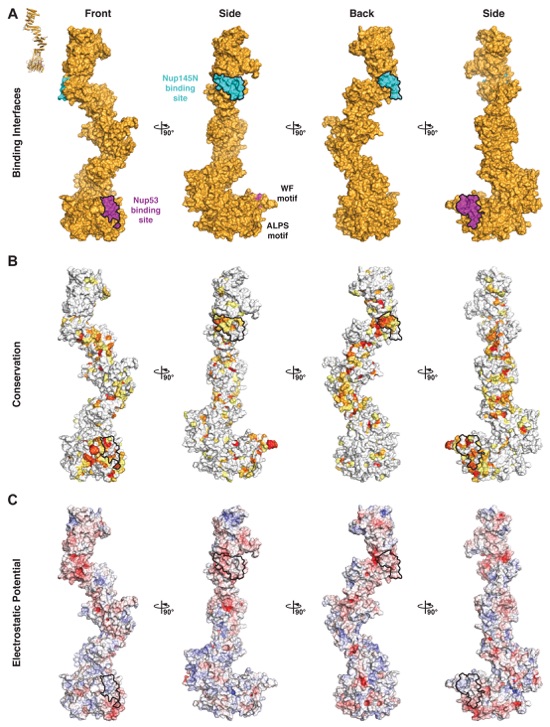
Fig. S22. Mutational analysis of Nup170NTD•Nup53 and proposed interactions with the nuclear envelope. SEC interaction experiments performed with mutants of (A) Nup170NTD and (B) GST-Nup53329-361. SEC profiles of wild type Nup170NTD (dark gray) and GST-Nup53329-361 (light gray) are shown individually and after preincubation (black) and are annotated with arrows of the same color. Mutant SEC profiles are colored according to the measured effect: no effect (green), weak effect (yellow), moderate effect (orange), and abolished binding (red). All SEC profiles were obtained using a Superdex 200 10/300 GL column. (C) Nup170NTD is shown in cartoon representation and possible membrane interaction motifs are highlighted. The Nup170 β-propeller domain contains two sequence motifs, WF and ALPS, which are located on the same face directly adjacent to a C-terminal amphipathic helix of Nup53 that has previously been shown to anchor Nup53 to the nuclear envelope (18, 19). (D) Helical wheel diagrams of the Nup170 ALPS motif in C. thermophilum, S. cerevisiae, and H. sapiens are shown with hydrophobic and polar residues colored in yellow and purple, respectively. The universally conserved proline residue on the polar face of the helix, a feature reminiscent of antimicrobial membrane-destabilizing peptides, is colored in red (34).
Fig. S23. Mutational and structural analyses of the Nup170CTD-Nup145N interaction. SEC interaction experiments performed with mutants of (A) Nup170CTD and (B) GST-Nup145N729-750. SEC profiles of wild type Nup170CTD (dark gray) and GST-Nup145N729-750 (light gray) are shown individually and after preincubation (black) and are annotated with arrows of the same color. Mutant SEC profiles colored according to measured effect: no effect (green), weak effect (yellow), moderate effect (orange), and abolished binding (red). All SEC profiles were obtained using a Superdex 200 10/300 GL column. (C) Comparison of the Nup145N binding pocket in Nup170 in the bound and apo states reveals minimal conformational changes upon binding.
Fig. S24. The Nup170CTD-Nup145N interaction is conserved in humans and partially disrupted by phosphomimetic mutations. (A) Sequence alignment of Nup145N729-750 and hsNup98596-617. Nup145N729-750 mutants are indicated by circles and colored as in Fig. 3J. hsNup98 residues S608 and S612 that are phosphorylated during mitosis are indicated (35). (B) Close-up view of the Nup170CTD-Nup145N interaction indicating the positioning of T741 and S745 in Nup145N, which correspond to the mitotically phosphorylated hsNup98 residues S608 and S612. (C) SEC interaction analysis of the hsNup155CTD-hsNup98596-617 interaction. SEC profiles of hsNup155CTD (light gray) and hsNup98596-617 (dark grey), the preincubation of the wild type proteins (black), and the preincubation of hsNup155CTD with the phosphomimetic hsNup98596-617 S608E/S612E double mutant (red) are shown. All SEC profiles were obtained using a Superdex 200 10/300 GL column. Gray bars indicate fractions that were resolved on SDS-PAGE gels and visualized by Coomassie staining.
Fig. S25. Superposition-generated structures of full-length Nup170. (A) The construct boundaries of Nup170SOL are indicated by a black line above the domain structure. The crystal structures of Nup170SOL (green), Nup170NTD (light orange), and Nup170CTD (dark orange), and their superposition are shown in cartoon representation. (B) Complete conformational range of Nup170 generated by superposing different conformations of Nup170CTD with the structure of Nup170SOL. Conformations were obtained from the Nup170SOL structure (conformation 1), different molecules in the asymmetric unit of the apo Nup170CTD structures (conformations 2, 3, and 4), and different molecules in the asymmetric unit of the Nup170CTD•Nup145N complex structure (conformations 5, 6, 7, and 8). The conformations that were docked into cryoET reconstruction of the NPC are indicated below.
Fig. S26. Surface properties of Nup170. Surface representations of Nup170 is shown in four different orientations related by 90° rotations. Nup53 and Nup145N binding interfaces are outlined in black. (A) Surface representation with the Nup53 and Nup145N binding sites colored in purple and cyan, respectively. (B) Surface representation colored according to sequence identity based on the alignment in fig. S21. (C) Surface representation colored according to electrostatic potential from -10 kBT/e (red) to +10 kBT/e (blue).
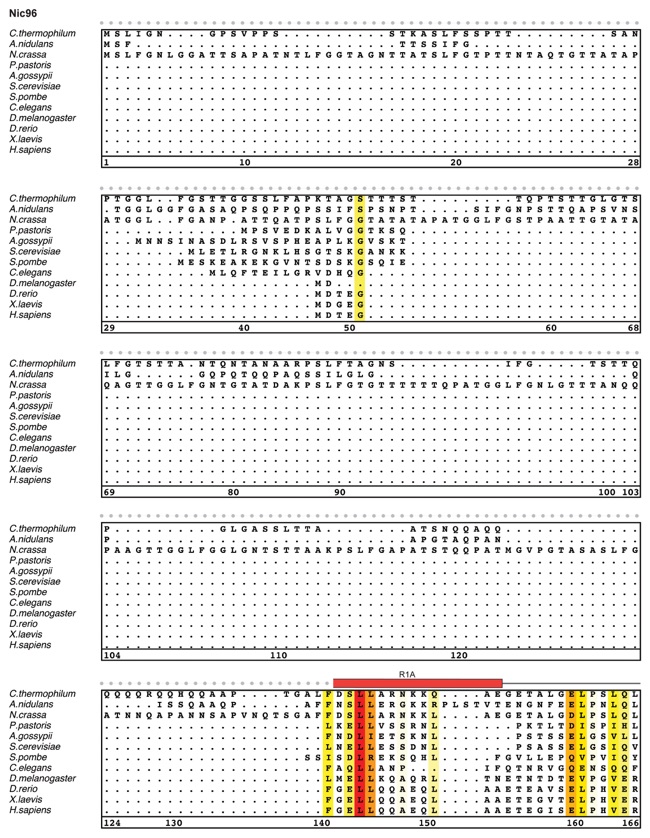
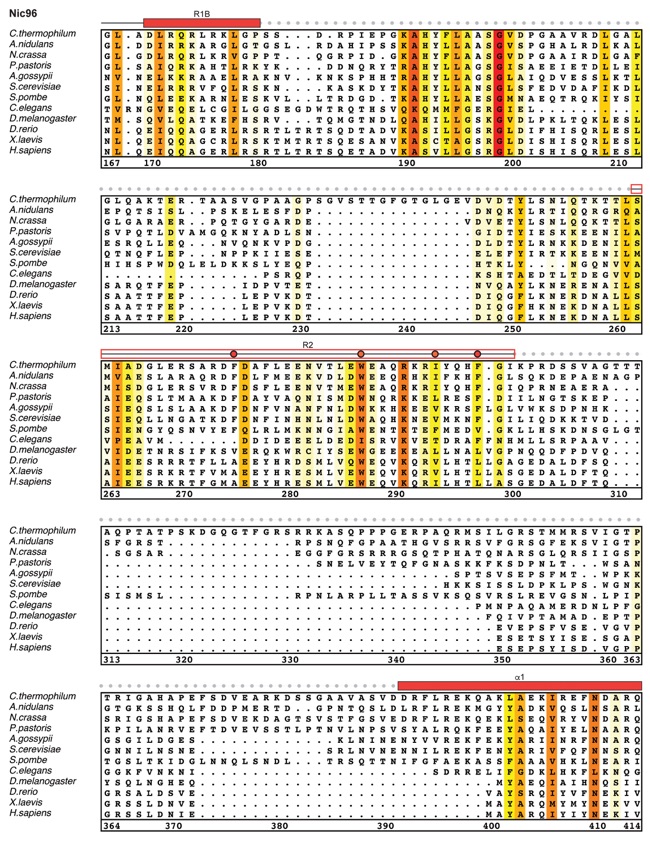
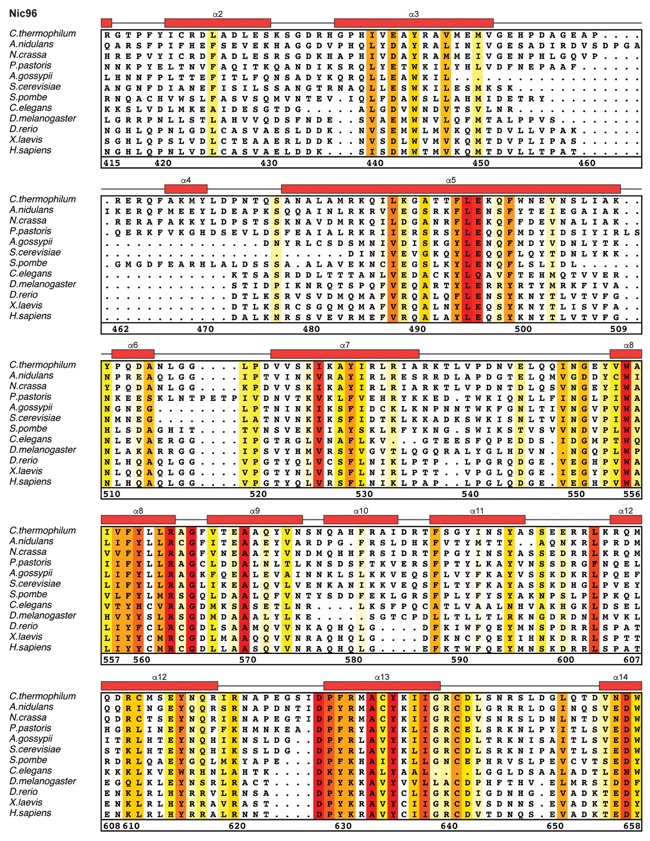
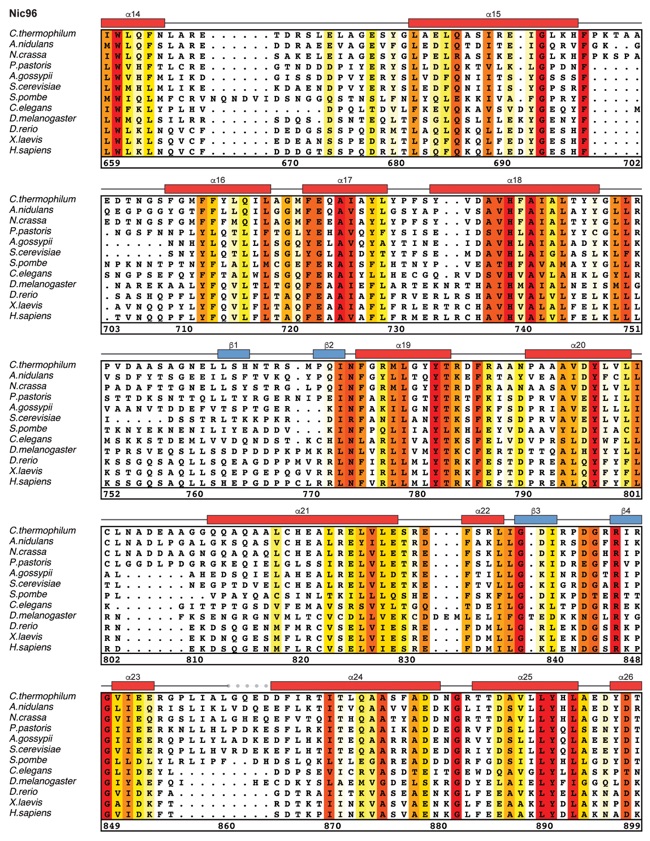
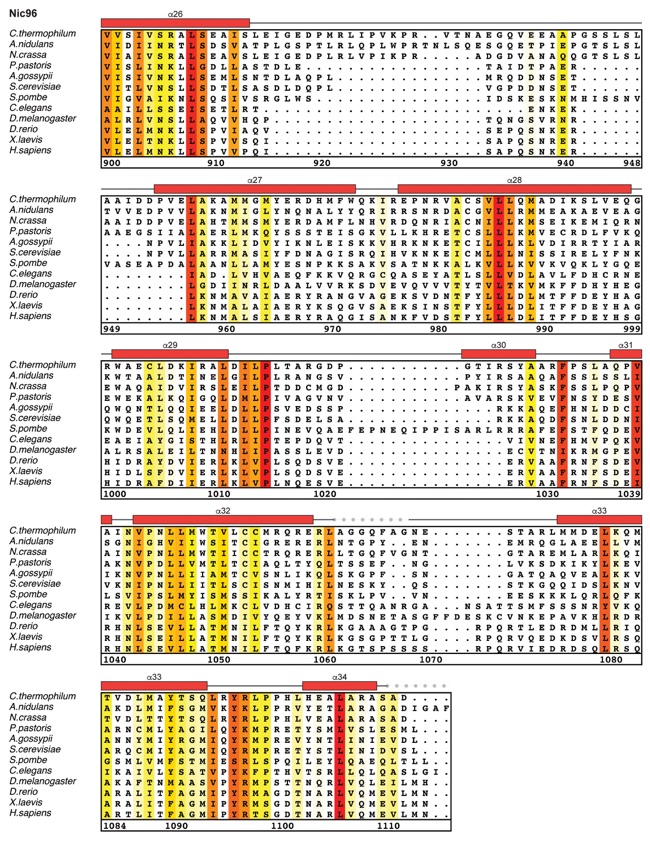
Fig. S27. Multispecies sequence alignment of Nic96SOL. Sequences from twelve diverse species were aligned and colored by sequence similarity according to the BLOSUM62 matrix from white (less than 55 % similarity), to yellow (55 % similarity), to red (100 % identity). Numbering below alignment is relative to the C. thermophilum sequence. Secondary structure observed in the Nic96 structure is shown above the alignment: α-helices (red bars), β-sheets (blue bars), and unstructured regions (black lines). The secondary structure of R2 is unknown, but predicted to be helical, which is indicated by a red outline. Mutations that affect binding to Nup53, Nup188, or Nup192 found by mutational analysis (figs. S20 and S28) are indicated by circles above the alignment and colored according to the measured effect; weak effect (yellow), moderate effect (orange), and abolished binding (red). Disordered regions are indicated by gray dots.
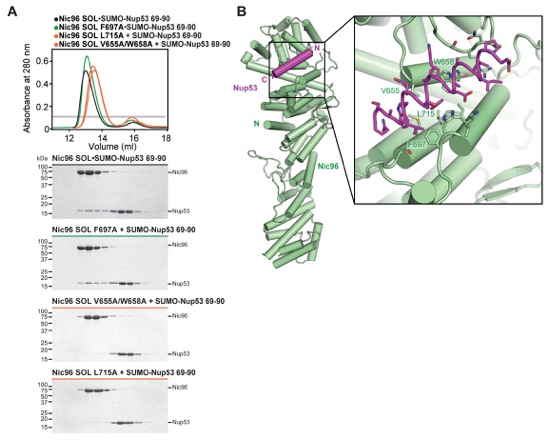
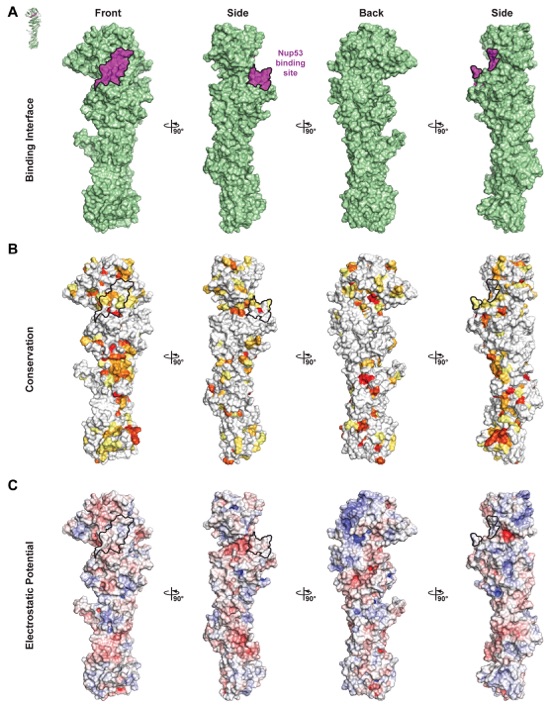
Fig. S28. Identification of Nic96SOL mutants that disrupt Nup53 binding. (A) SEC interaction analysis between Nic96SOL mutants and SUMO-Nup5369-90. SEC profiles are colored according to the effect on SUMO-Nup5369-90 binding; no effect (green), moderate effect (orange), or abolished binding (red). For reference, the SEC profile of the wild type Nic96SOL•SUMO-Nup5369-90 hetero-dimer (black) is shown. All SEC profiles were obtained using a Superdex 200 10/300 GL column. A gray bar indicates fractions that were resolved on SDS-PAGE gels and visualized by Coomassie staining. (B) The structure of Nic96SOL•Nup53R2 is shown in cartoon representation. The inset illustrates the region that is expanded on the right with mutated residues labeled in green.
Fig. S29. Surface properties of Nic96SOL. Surface representations of Nic96SOL are shown in four different orientations related by 90° rotations. The Nup53 binding interface is outlined in black. (A) Surface representation with the Nup53 binding site colored in purple. (B) Surface representation colored according to sequence identity based on the alignment in fig. S27. (C) Surface representation colored according to electrostatic potential from -10 kBT/e (red) to +10 kBT/e (blue).
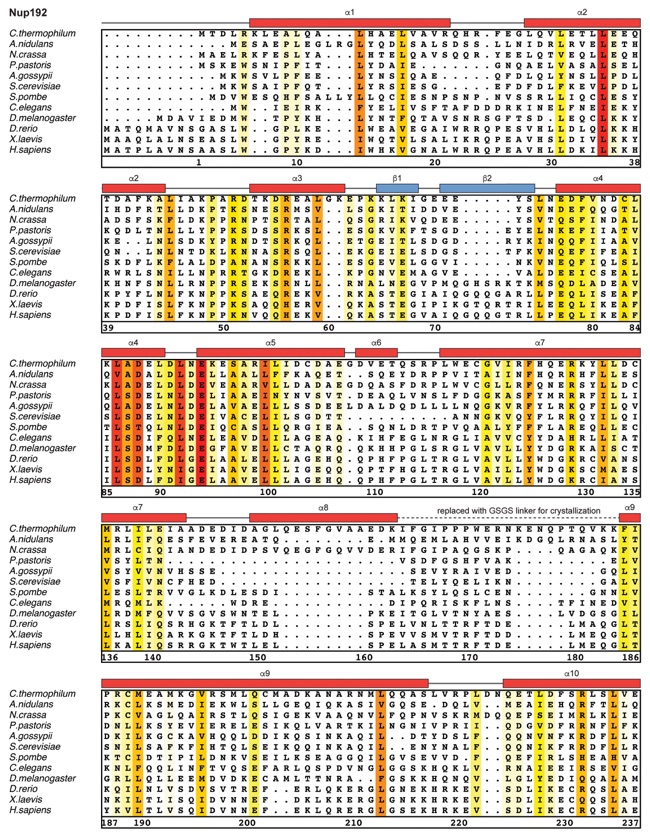
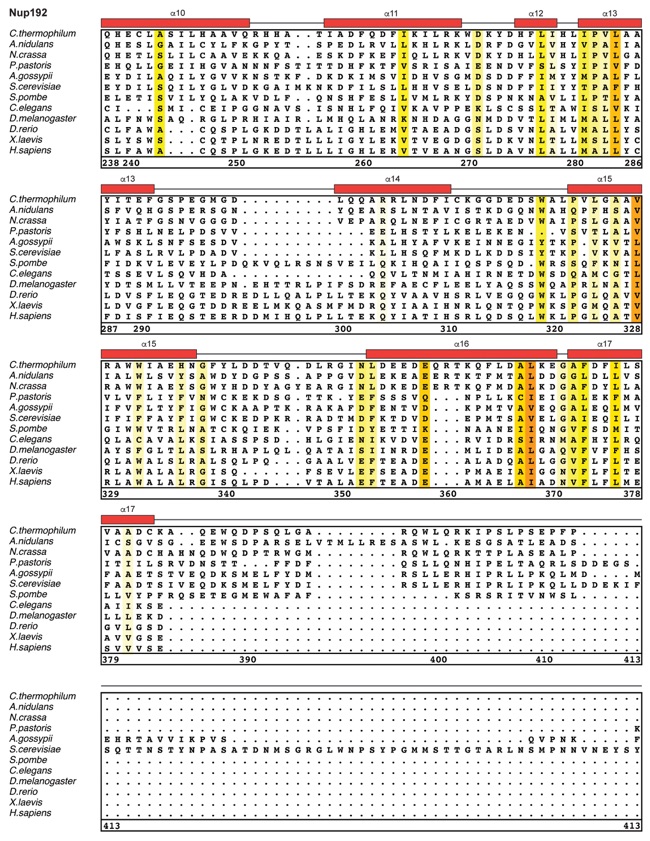
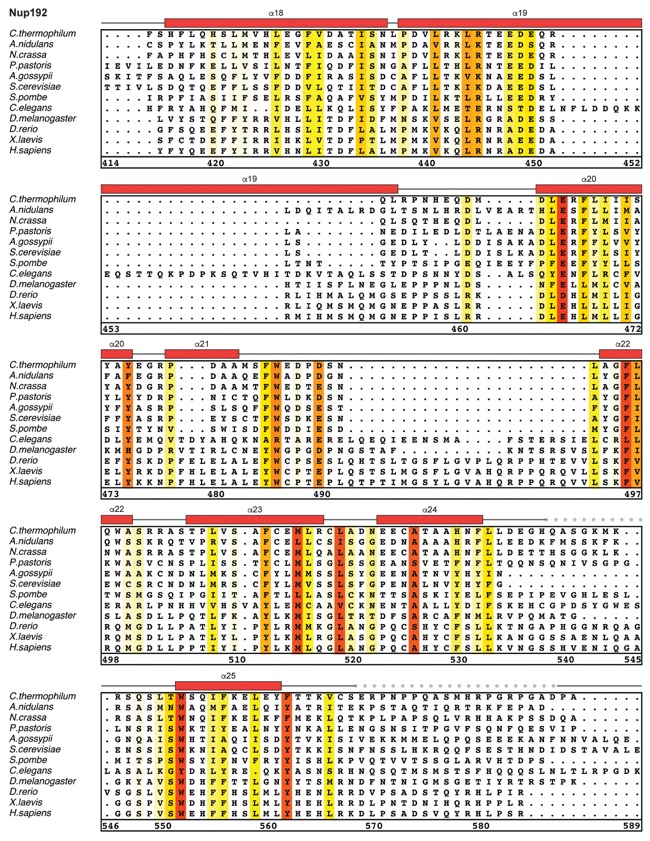
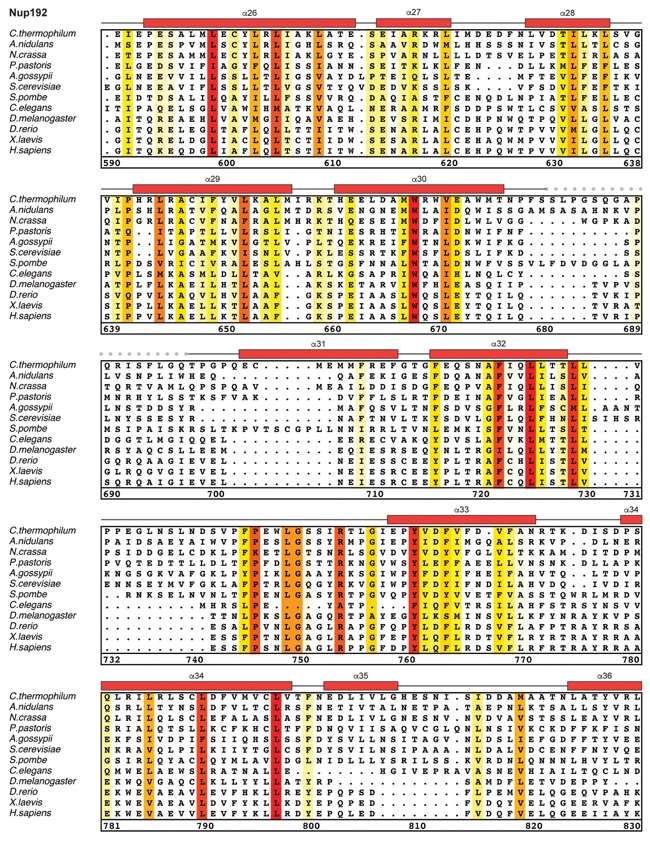
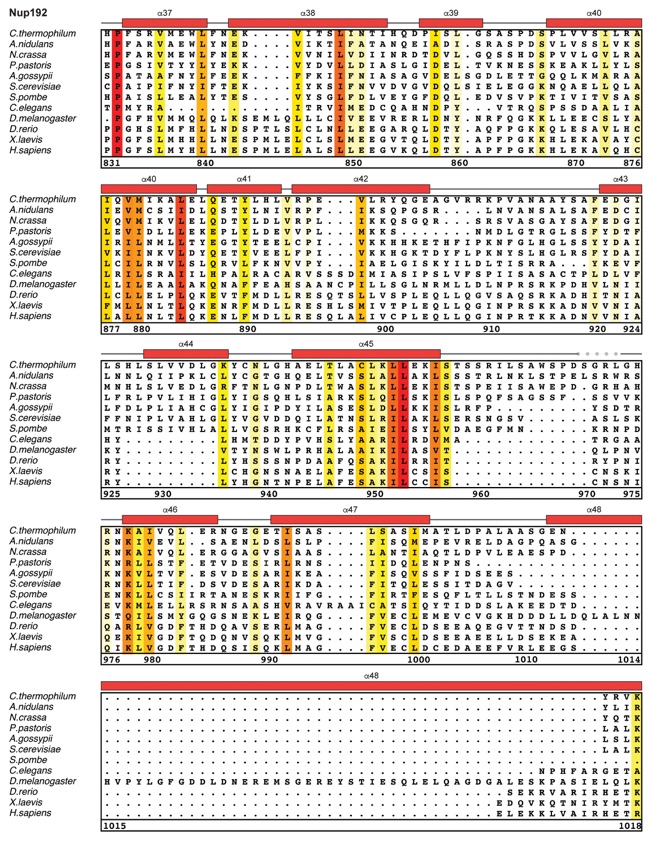
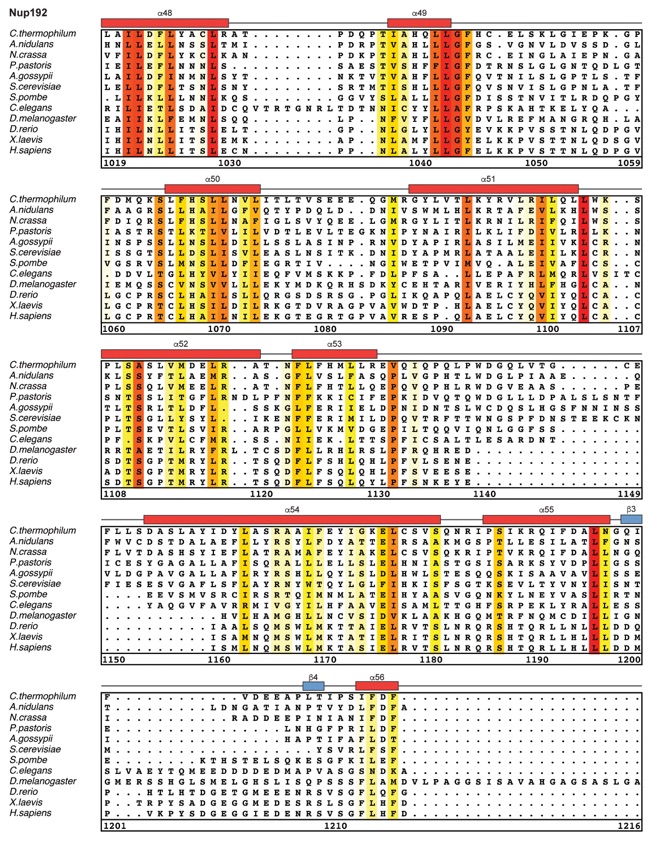
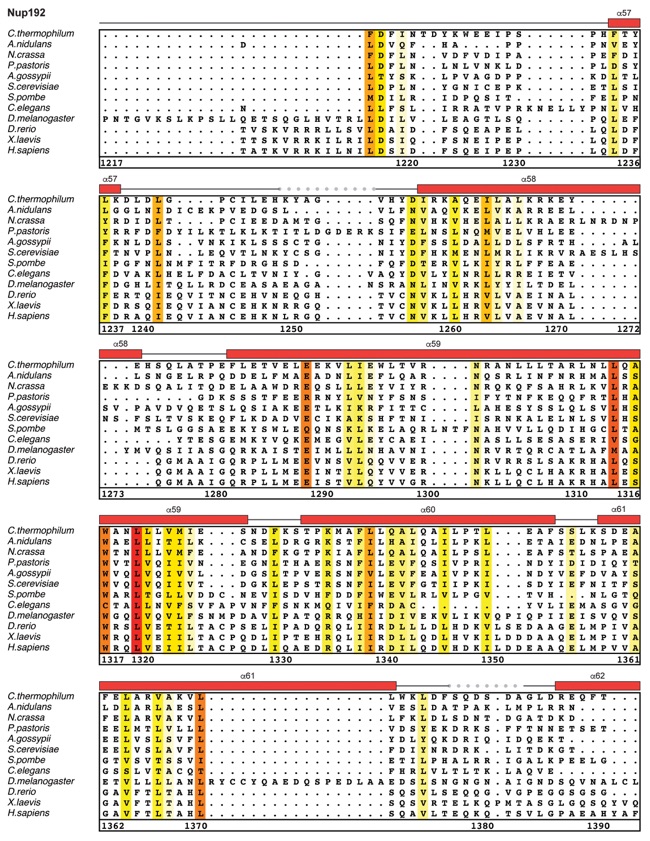
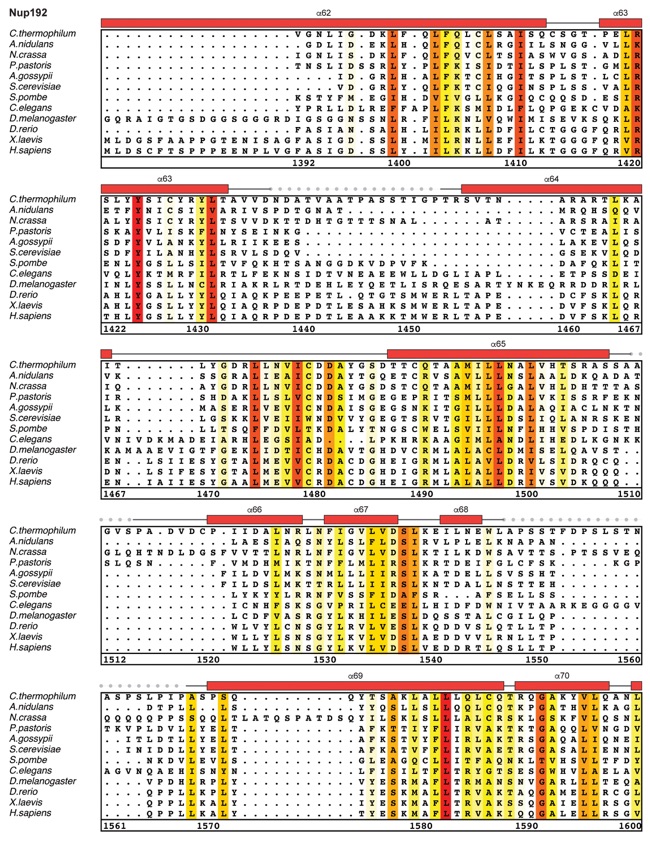
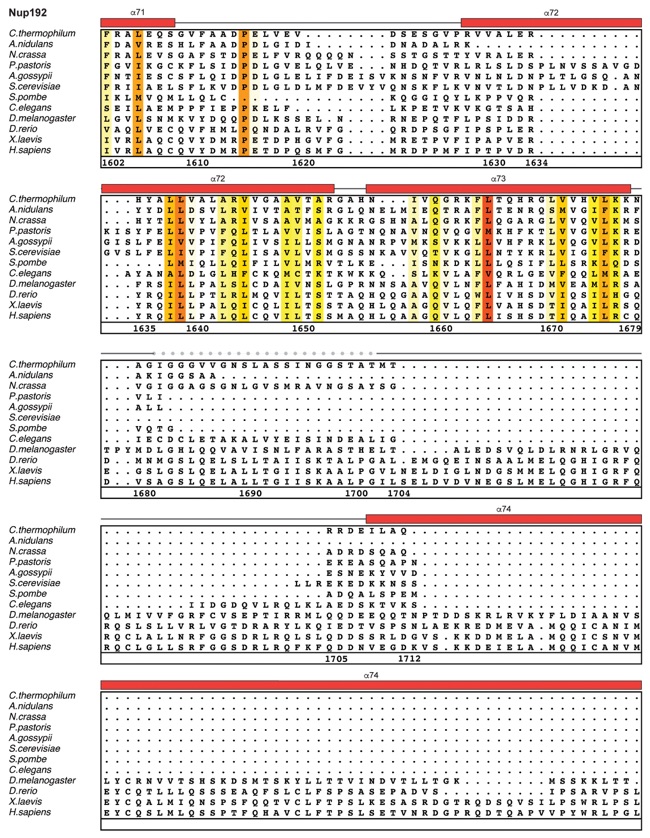
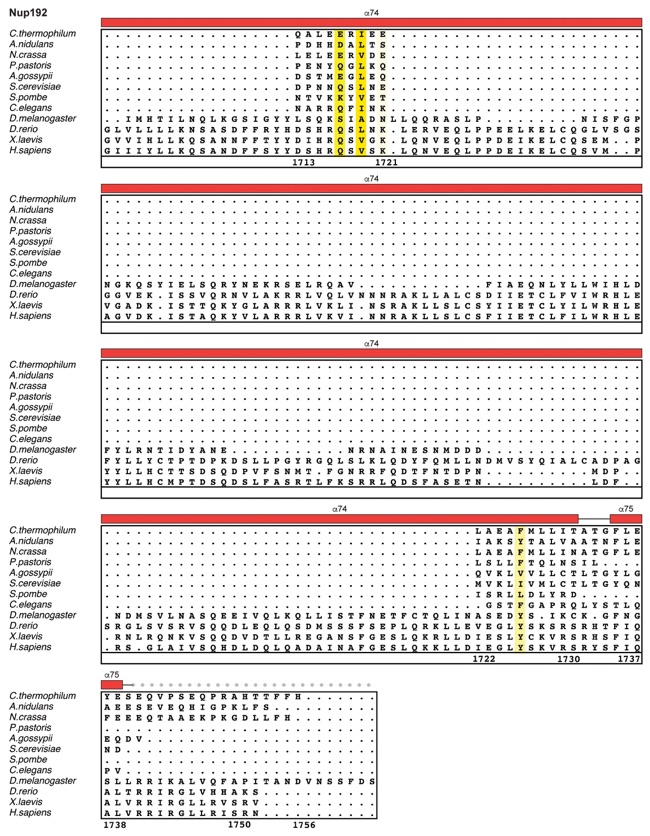
Fig. S30. Multispecies sequence alignment of Nup192. Sequences from twelve diverse species were aligned and colored by sequence similarity according to the BLOSUM62 matrix from white (less than 55 % similarity), to yellow (55 % similarity), to red (100 % identity). Numbering below alignment is relative to the C. thermophilum sequence. Secondary structure observed in the Nup192 structure is shown above the alignment: α-helices (red bars), β-sheets(blue bars), and unstructured regions (black lines). A dashed line indicates the loop that was deleted for crystallization. Disordered regions are indicated by gray dots.
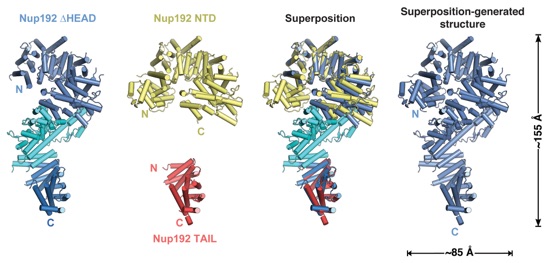
Fig. S31. Superposition-generated structure of full-length Nup192. Cartoon representations of the crystal structures of Nup192∆HEAD (colored as in Fig. 4F), Nup192NTD (yellow), and Nup192TAIL (red) and their superposition are shown. A cartoon representation of the superposition-generated structure of full-length Nup192 (blue) generated from the superposition is shown on the right.
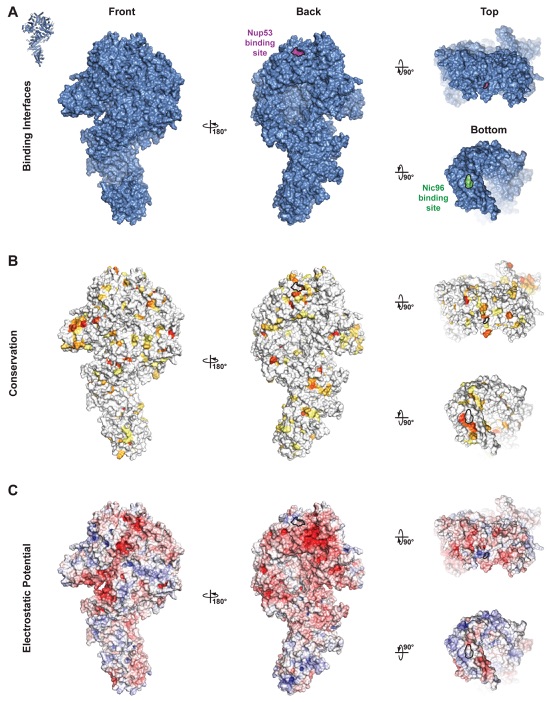
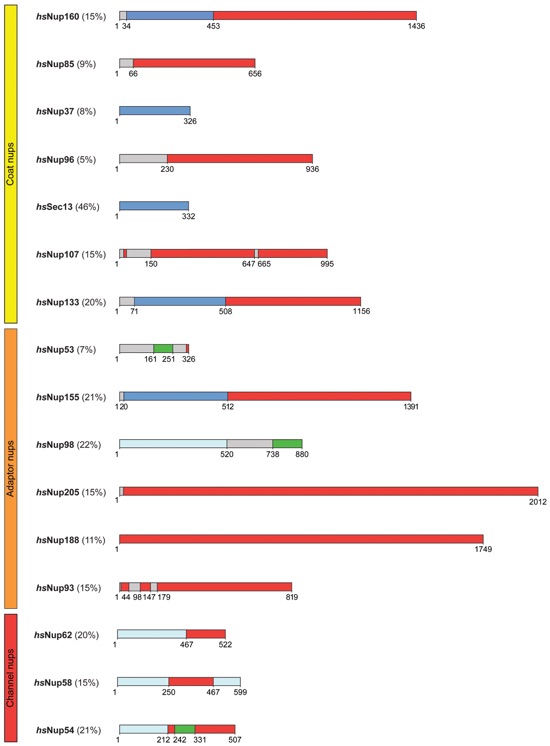
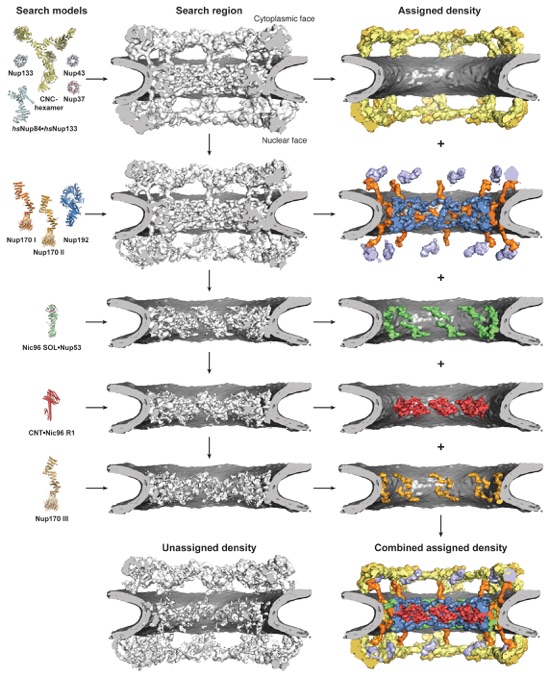
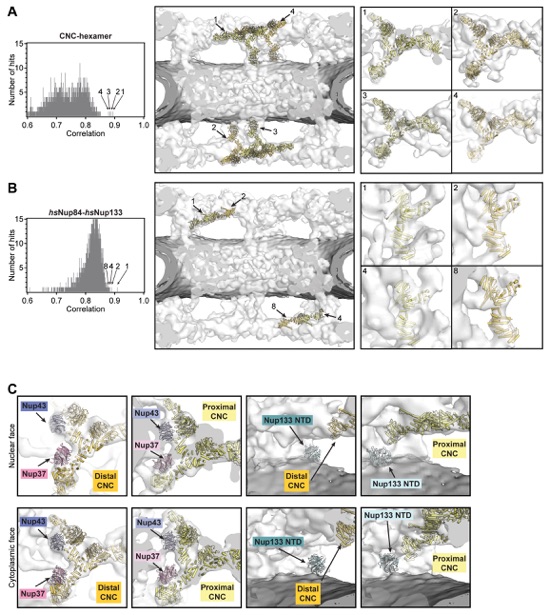
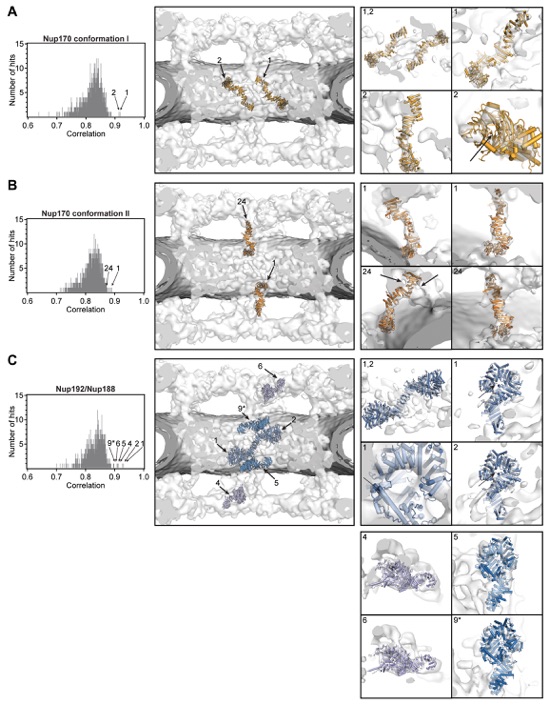
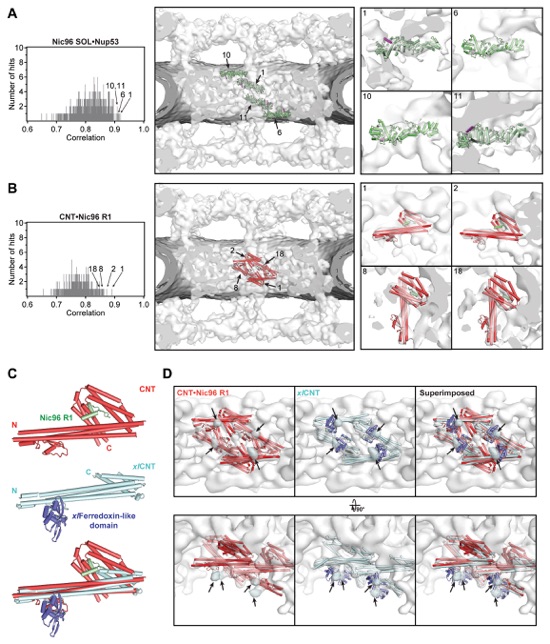
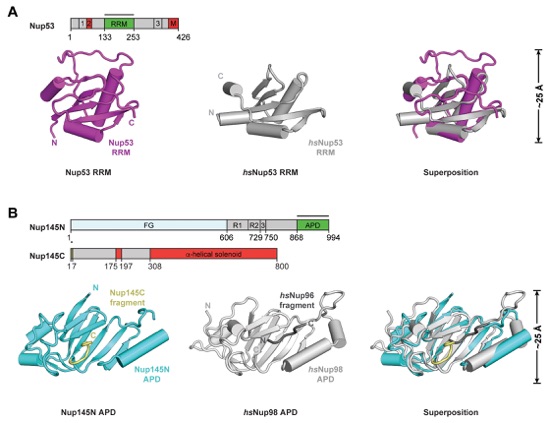
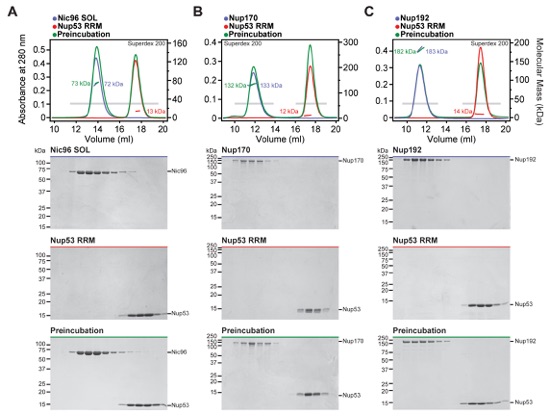
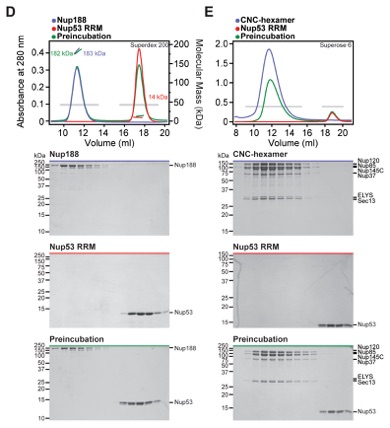
Fig. S32. Surface properties of Nup192. Surface representations of Nup192 are shown in four different orientations. The surfaces corresponding to previously identified point mutations that disrupt interactions with Nup53 or Nic96 are outlined in black. (A) A surface representation of Nup192 with previously identified point mutations that disrupt interactions with Nup53 or Nic96 colored purple or green, respectively (15, 20). (B) Surface representation colored according to sequence identity based on the alignment in fig. S30. (C) Surface representation colored according to electrostatic potential from -10 kBT/e (red) to +10 kBT/e (blue).
Fig. S33. Domain structures of symmetric core nucleoporins are conserved between H. sapiens and C. thermophilum. Predicted domain boundaries are shown for the symmetric core nucleoporins from H. sapiens using H. sapiens nomenclature. Percent sequence identity to C. thermophilum is shown in parenthesis.
Fig. S34. Flowchart of the incremental approach used to dock crystal structures into the cryoET reconstruction of the intact human NPC. For each docking step, the crystal structures used for global searches are shown on the left (search model) and the cryoET reconstruction the searches were performed with is shown in the middle (search region). Newly assigned density that was removed from the cryoET reconstruction in subsequent searches is shown on the right and colored as the crystal structure that was placed (assigned density). The remaining unassigned density and combined assigned density are shown at the bottom middle and right, respectively.
Fig. S35. Docking of the CNC-hexamer and Nup84•Nup133 crystal structures into the cryoET reconstruction of the intact human NPC. On the left, histograms of the cross-correlation scores from a global search with 50,000 random initial placements are shown for (A) the yeast CNC-hexamer (PDB ID 4XMM) and (B) hsNup84•hsNup133 hetero-dimer (PDB ID 3I4R) (14, 23). Arrows and corresponding numbers indicate the unique solutions that were accepted and the rank of the score, respectively. The arrangement of the unique solutions in one spoke is shown in the middle. The densities corresponding to the nuclear envelope and the NPC are colored in dark gray and white, respectively. Representative views illustrating the quality of the fits are shown on the right. The numbers on the top left of the box indicate which solution is depicted. (C) Manual docking of Nup43 (PDB ID 4I79; periwinkle), Nup37 (PDB ID 4FHM; pink), and Nup133NTD (PDB ID 1XKS; turquoise) β-propellers into cryoET density guided by previously published biochemical and structural data (39-41, 63).
Fig. S36. Docking of the superposition-generated full-length Nup170 and Nup192 structures into the cryoET reconstruction of the intact human NPC. On the left, histograms of the cross-correlation scores from a global search with 50,000 random initial placements are shown for (A) Nup170 conformation I (light orange), (B) Nup170 conformation II (dark orange), and (C) Nup192 (blue), Nup188 (purple). The Nup170 conformations I and II correspond to conformations 5 and 2, respectively, in fig. S25. Arrows and corresponding numbers indicate the unique solutions that were accepted and the rank of the score, respectively. For Nup192, we accepted 5 placements from the global search results, two placements in the inner ring, two placements in the outer rings, and one placement on the nuclear peripheral side of the inner ring. A matching cytoplasmic peripheral placement was not found in global searches, but the manual placement on the cytoplasmic peripheral side of the inner ring generated a score which would rank as the 9th highest score (asterisk). The arrangement of the unique solutions in one spoke is shown in the middle. The densities corresponding to the nuclear envelope and the NPC are colored in dark gray and white, respectively. Representative views illustrating the quality of the fits are shown on the right. The numbers on the top left of the box indicate which solution is depicted.
Fig. S37. Docking of Nic96SOL and CNT crystal structures into the cryoET reconstruction of the intact human NPC. On the left, histograms of the cross-correlation scores from a global search with 50,000 random initial placements are shown for (A) Nic96SOL•Nup5369-90 (green) and (B) CNT•Nic96R1 (PDB 5CWS; red). Arrows and corresponding numbers indicate the unique solutions that were accepted and the rank of the score, respectively. The arrangement of the unique solutions in one spoke is shown in the middle. The densities corresponding to the nuclear envelope and the NPC are colored in dark gray and white, respectively. Representative views illustrating the quality of the fits are shown on the right. The numbers on the top left of the box indicate which solution is depicted. (C) Crystal structures of the Chaetomium thermophilum CNT•Nic96R1 hetero-tetramer (PDB ID 5CWS; red and green; top), the X. laevis CNT hetero-trimer (PDB ID 5C3L; light cyan; middle) and ferredoxin-like domain (PDB ID 5C2U; purple; middle), and their superposition (bottom) are shown in cartoon representation (15, 16). (D) The four knobs of unexplained density directly adjacent to the docked CNT•Nic96R1 crystal structures (colored in cyan and marked with arrows) are readily explained by the presence of the ferredoxin-like domain, a metazoan-specific insertion in Nup57. Side views from within the central transport channel of the NPC (top) and top views from the cytoplasm (bottom) are shown of the cryoET reconstruction with the docked CNT•Nic96R1 crystal structures (left), the model of X. laevis CNT with ferredoxin-like domain (middle), and their superposition (right).
Fig. S38. Crystal structures of Nup53RRM and Nup145NAPD•Nup145CN. (A) Crystal structures of C. thermophilum Nup53RRM (purple), H. Sapiens Nup53RRM (PDB ID 4LIR; gray), and their superposition are shown in cartoon representation. The core fold is conserved, but there are minor alterations in the size of helices and loops. (B) Crystal structures of the C. thermophilum Nup145NAPD•Nup145CN complex (cyan), the H. sapiens Nup98APD•Nup96N complex (PDB ID 1KO6; light gray), and their superposition are shown in cartoon representation. As previously observed for the hsNup98APD•hsNup96N hetero-dimer, fusion of the Nup145CN peptide to Nup145NAPD and introduction of the catalytically inactive T994A mutation allowed for structure determination of the Nup145NAPD•Nup145CN complex. Nup145CN occupied the same binding grove as previously observed in the hsNup98•hsNup96 complex (30). As references, the domain structures of Nup53, Nup145N, and Nup145C are shown above the crystal structures with black bars indicating the crystallized fragments.
Fig. S39. Nup53RRM does not interact with inner ring scaffold nucleoporins or the CNC-hexamer. (A-E) SEC-MALS profiles of nucleoporins or nucleoporin complexes are shown individually (blue and red) and after their preincubation (green). SEC profiles were obtained using gel filtration columns. Measured molecular masses are indicated for the peak fractions. Gray bars indicate fractions that were resolved on SDS-PAGE gels and visualized by Coomassie staining.
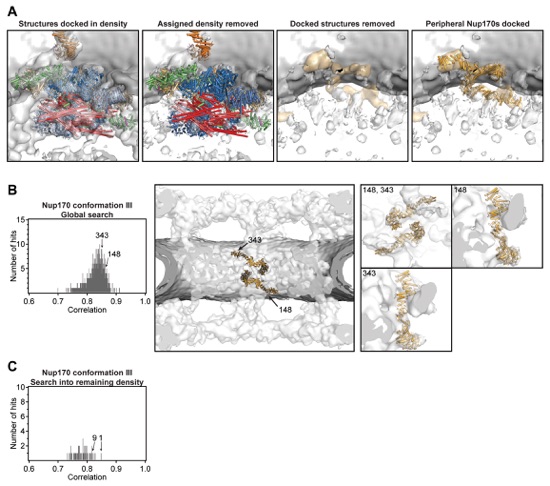
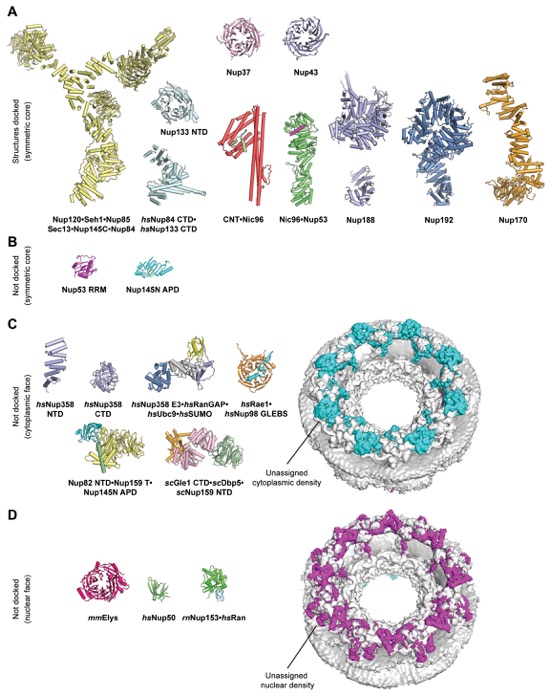
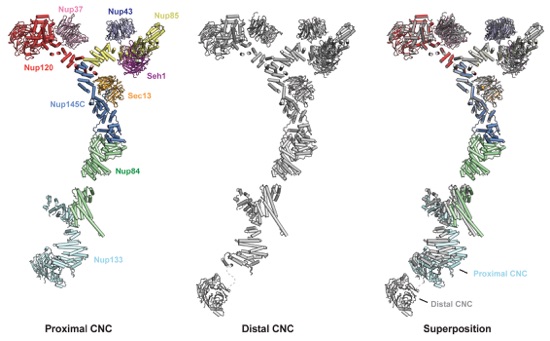
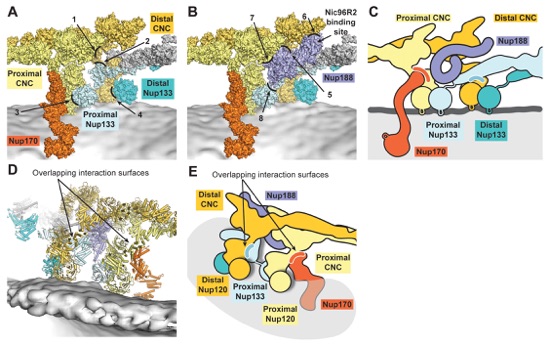
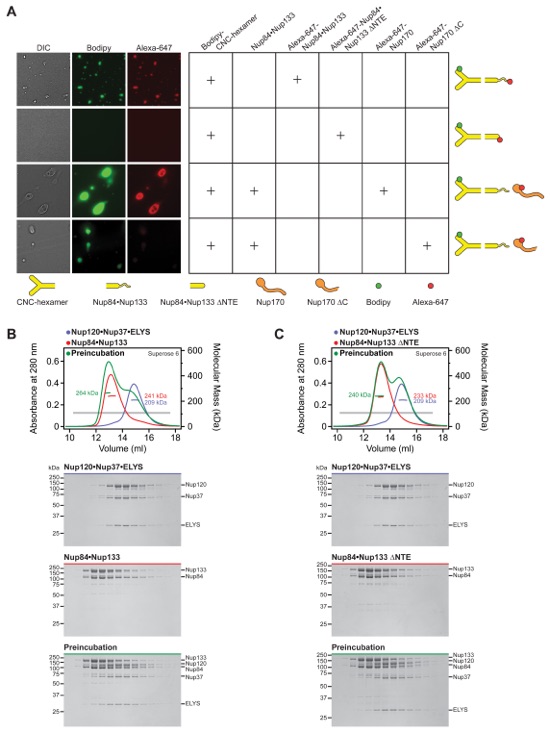
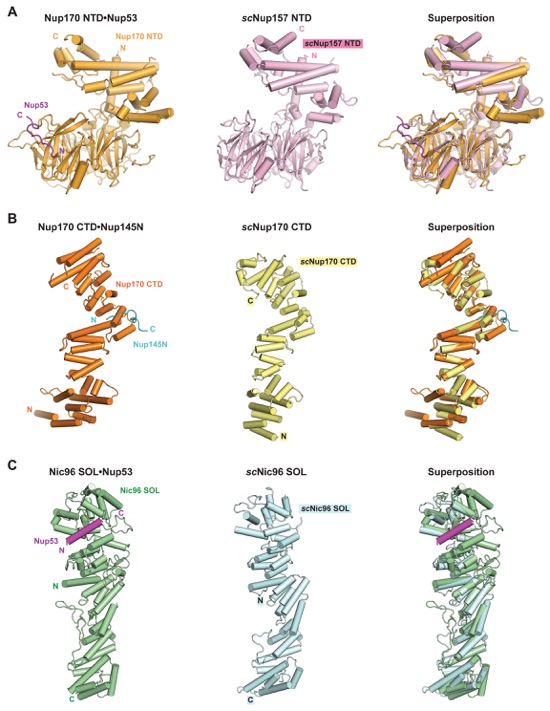
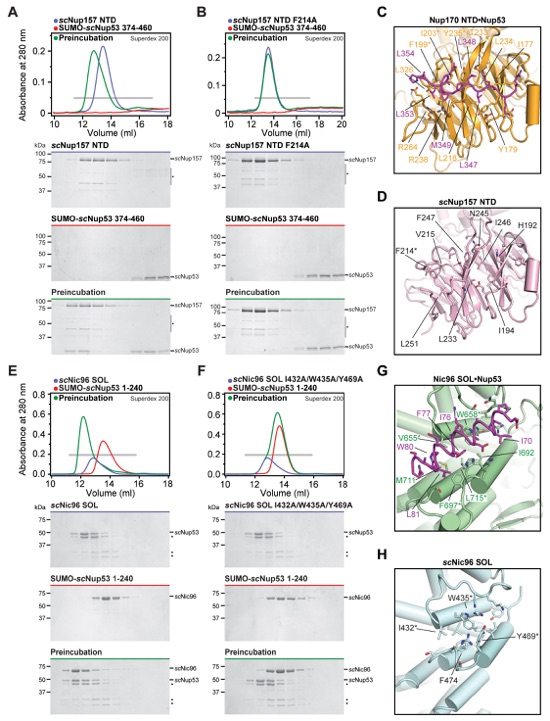
Fig. S40. Identification of a third pair of Nup170 molecules in the inner ring of the cryoET reconstruction of the intact human NPC. (A) Views of the cryoET density in the inner ring illustrating all density and the docked proteins from the unbiased search (far left), the cryoET density remaining after removal of the assigned density and the docked proteins (middle left), the remaining cryoET density without the docked proteins from the unbiased search revealing density that is shaped like a Nup170 molecule colored in orange (middle right), and the same density with a third conformation of Nup170 docked (far right). (B) Search results for two additional Nup170 molecules fitted into a cryoET map from which the density for the CNCs had been removed. The histogram on the left shows the cross-correlation scores for a pair of Nup170 conformation III (light orange) from a global search with 50,000 random initial placements. Nup170 conformation III corresponds to conformation 8 in fig. S25. Arrows and corresponding numbers indicate the unique solutions that were accepted and the rank of the score, respectively. The arrangement of the unique solutions in one spoke is shown in the middle. The densities corresponding to the nuclear envelope and the NPC are colored in dark gray and white, respectively. Representative views illustrating the quality of the fits are shown on the right. The numbers on the top left of the box indicate which solution is depicted. (C) A histogram illustrating the search results for fitting Nup170 conformation III into a cryoET map of the inner ring from which the density corresponding to all other components had been removed.
Fig. S41. Summary of crystal structure docking into the cryoET reconstruction of the intact human NPC. (A) Crystal structures of the symmetric core nucleoporins that could be successfully docked into a cryoET reconstruction of the intact human NPC. (B-D) Crystal structures of symmetric core nucleoporin domains, the cytoplasmic filament nucleoporins, and nuclear basket nucleoporins, which were not docked due to their small size, indistinctive shape, and lack of biochemical restraints. Cytoplasmic and nuclear views of the cryoET reconstruction of the intact human NPC are shown on the right. The assigned density of the symmetric NPC core is colored in gray, and the unassigned densities on the cytoplasmic and nuclear faces are colored in cyan or purple, respectively. The volume of the unassigned density appears to be sufficient to accommodate the majority of the remaining structured protein mass of the asymmetric cytoplasmic filament and nuclear basket nucleoporins. All crystal structures are shown to scale in cartoon representation.
Fig. S42. Comparison of the distal and proximal CNC docking solutions. Individual distal (multicolored; left) and proximal (gray; middle) CNCs are shown in a cartoon representation. Their superposition reveals a dramatically different orientation for Nup133NTD and slightly different orientations of the Nup133 and Nup84 solenoids (right).
Fig. S43. Interactions mediating inter-spoke assembly. (A) The outer ring inter-spoke interface is shown in surface representation, but with Nup188 removed for clarity. Contacts observed between CNCs from different spokes are indicated by arrows and numbered from 1 to 4, corresponding to the contacts described in the text. (B) The same view as in panel (A), but with Nup188 also shown in a surface representation. Contacts observed between Nup188 and the CNCs at the inter-spoke interface are indicated by arrows and numbered from 5 to 8, corresponding to the contacts described in the text. An arrow highlights the Nic96R2 binding site on Nup188. (C) Schematic of the inter-spoke interface, from the same view as in panel (A). (D) The outer ring inter-spoke interface, shown in cartoon representation, ~180° rotated from the view in panel (A). Nup170 and Nup133 contact overlapping interfaces on proximal and distal Nup120 molecules. (E) Schematic of the outer ring inter-spoke interface drawn in the same view as in panel (D).
Fig. S44. Oligomerization of the CNC. (A) The CNC forms oil droplets in the presence of the unstructured N-terminal extension (NTE) of Nup133. The CNC-hexamer was labeled with Bodipy and various other nucleoporins were labeled with Alexa-647 and tested for their ability to form oil droplets. Nup170 incorporates CNC oil droplets, but this incorporation is ablated by deletion of C-terminal helices. Tested protein combinations are indicated in the table and shown schematically on the right. All experiments were repeated at least three times. (B, C) SEC-MALS profiles of nucleoporin complexes are shown individually (blue or red) and after their preincubation (green). There is a weak interaction between Nup120•Nup37•ELYS and Nup84•Nup133 only in the presence of the unstructured N-terminal extension (NTE) of Nup133. SEC profiles were obtained using a Superose 6 10/300 GL column. Measured molecular masses are indicated for the peak fractions. Gray bars indicate fractions that were resolved on SDS-PAGE gels and visualized by Coomassie staining.
Fig. S45. Overall nucleoporin folds are evolutionarily conserved. Structural comparison of C. thermophilum Nup170 and Nic96 complexes reported here and previously determined apo S. cerevisiae crystal structures, revealing extensive evolutionary conservation of the overall folds. (A) Nup170NTD•Nup53R3 (left), scNup157NTD (PDB ID 4MHC; middle), and their superposition (right) are shown in cartoon representation (21). (B) Nup170CTDNup145NR3 (left), scNup170CTD (PDB ID 3I5P; middle), and their superposition (right) are shown in cartoon representation (23). (C) Nic96SOL•Nup53R2 (left), scNic96SOL (PDB ID 2RFO; middle), and their superposition (right) are shown in cartoon representation (24). See also fig. S33.
Fig. S46. Binding pockets on scNup157 and scNic96 for scNup53 are evolutionarily conserved. (A, B) SEC interaction experiments were performed with constructs of S. cerevisiae Nup157NTD and Nup53 homologous to the crystallized Nup170NTD•Nup53R3 complex and with a mutant Nup157NTD construct in which a conserved F214 residue in the Nup53 binding pocket was mutated to alanine. SEC profiles of nucleoporins are shown individually (blue and red) and after their preincubation (green). (C) A close-up view of the Nup170NTD•Nup53R3 complex, same as Fig. 3C. (D) A close-up view of the corresponding surface of scNup157 (PDB ID 4MHC) reveals that the hydrophobic binding pocket for Nup53R3 is intact (21). An asterisk highlights the scNup157NTD mutant that abolished the interaction with scNup53. (E, F) Interaction experiments were performed with fragments of S. cerevisiae Nic96SOL and Nup53 homologous to the crystallized Nic96SOL•Nup53R2 complex and with mutant scNic96SOL in which conserved hydrophobic residues within the Nup53 binding pocket were mutated to alanine. SEC profiles of nucleoporins are shown individually (blue and red) and after their preincubation (green). (G) A close-up view of the Nic96SOL•Nup53R2 complex, same as Fig. 4C. (H) A close-up view of the corresponding surface of scNic96 (PDB ID 2RFO) reveals that the hydrophobic groove that recognizes Nup53R2 is intact (24). Asterisks highlight the scNic96SOL mutants that abolished the interaction with scNup53. All SEC profiles were obtained using a Superdex 10/300 GL column. Gray bars indicate fractions that were resolved on SDS-PAGE gels and visualized by Coomassie staining.
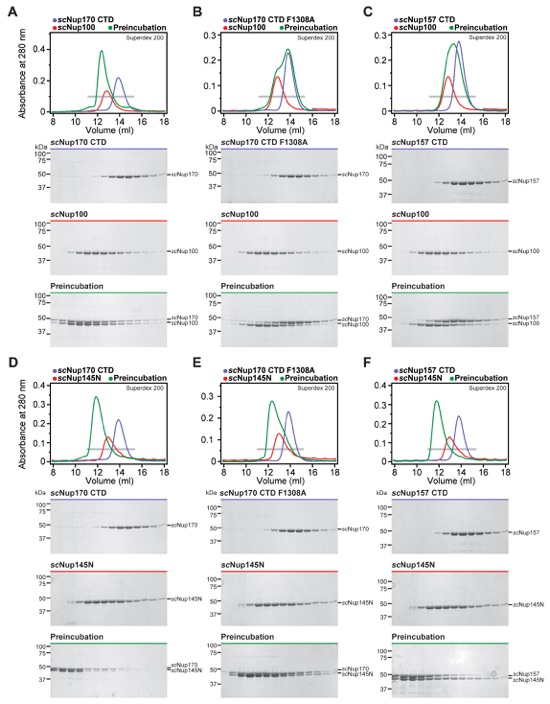
Fig. S47. Binding pockets on scNup157 and scNup170 for the Nup145N paralogs scNup100 and scNup145N are conserved. (A-F) SEC profiles of nucleoporins or nucleoporin complexes are shown individually (blue and red) and after their preincubation (green). All SEC profiles were obtained using a Superdex 200 10/300 GL column. Gray bars indicate fractions that were resolved on SDS-PAGE gels and visualized by Coomassie staining.
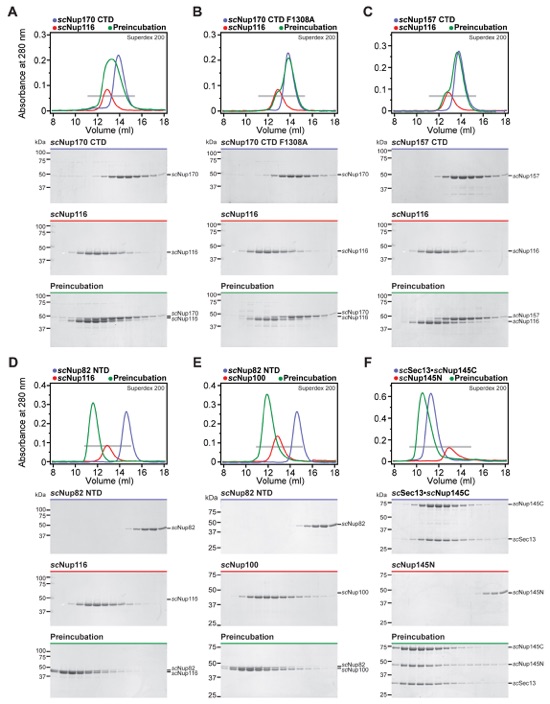
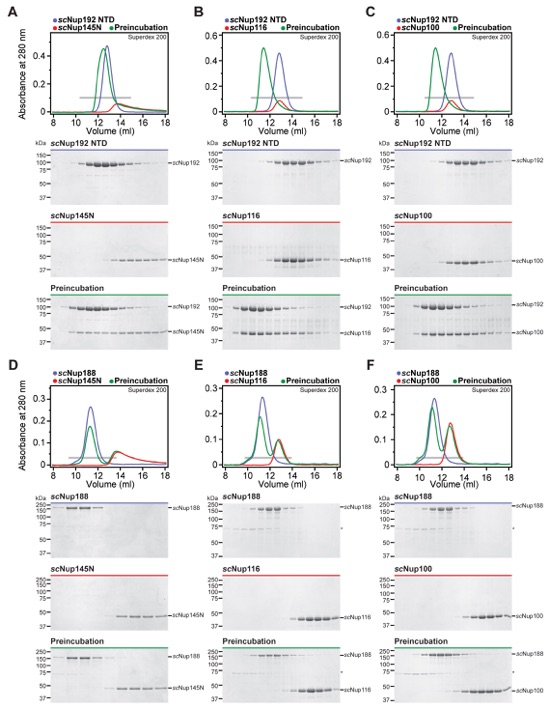
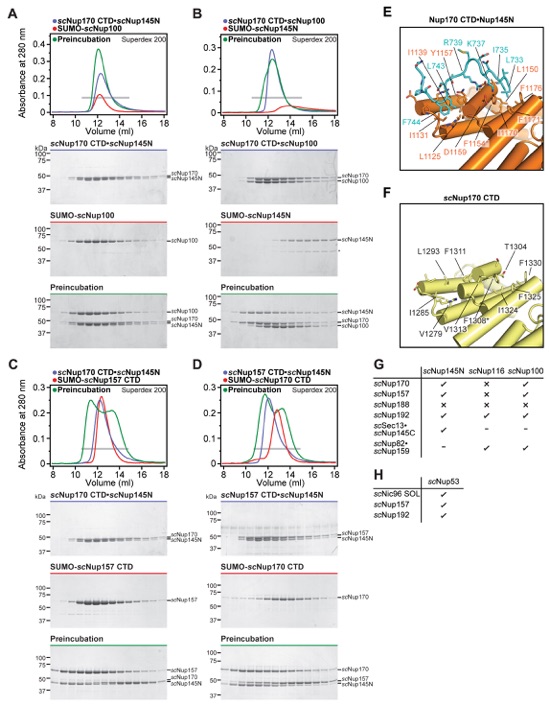
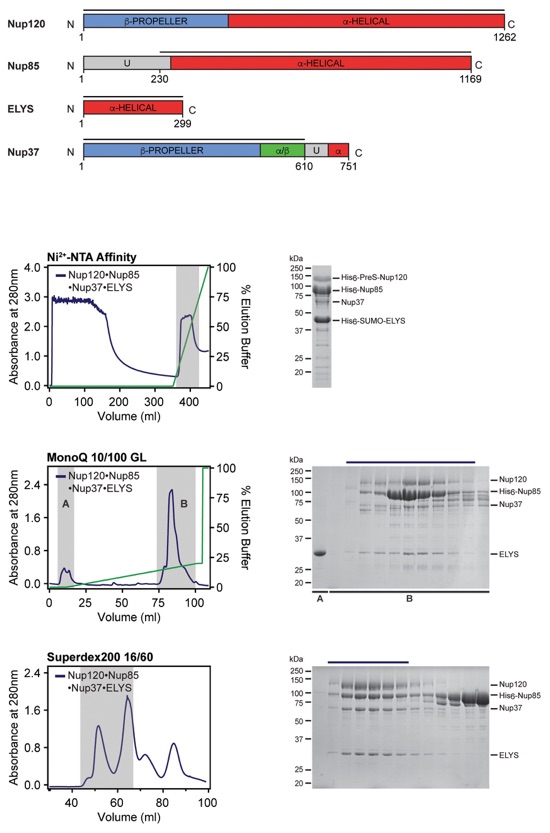
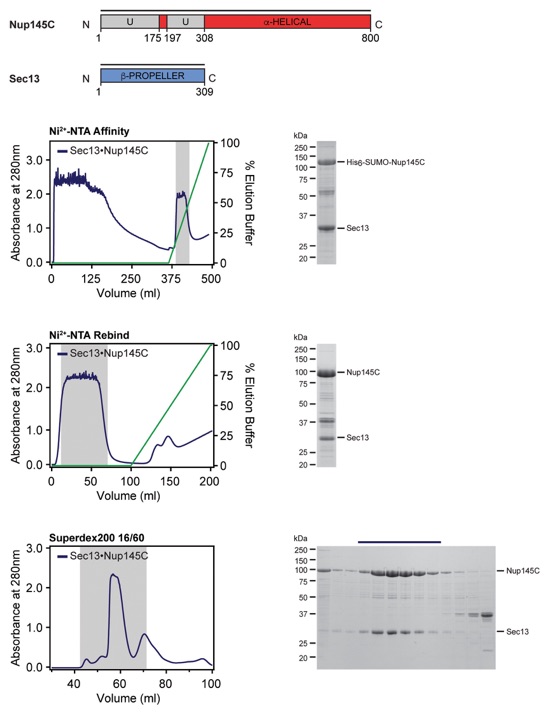
Fig. S48. Other Nup145N interactions are conserved in the three S. cerevisiae paralogs scNup100, scNup145N, and scNup116, but scNup116 only binds very weakly to Nup170CTD and Nup157CTD. (A-F) SEC profiles of nucleoporins or nucleoporin complexes are shown individually (blue and red) and after their preincubation (green). All SEC profiles were obtained using a Superdex 200 10/300 GL column. Gray bars indicate fractions that were resolved on SDS-PAGE gels and visualized by Coomassie staining.
Fig. S49. All three S. cerevisiae Nup145N paralogs bind to scNup192NTD, but none bind to scNup188. (A-F) SEC profiles of nucleoporins or nucleoporin complexes are shown individually (blue and red) and after their preincubation (green). All SEC profiles were obtained using a Superdex 200 10/300 GL column. Gray bars indicate fractions that were resolved on SDS-PAGE gels and visualized by Coomassie staining.
Fig. S50. scNup145N and scNup100 bind to scNup170CTD and scNup157CTD in a mutually exclusive fashion. (A, B) scNup145N and scNup100 bind to scNup170CTD in a mutually exclusive fashion and scNup145N outcompetes scNup100. (C, D) scNup157CTD and scNup170CTD bind to scNup145N in a mutually exclusive fashion. SEC profiles of nucleoporins or nucleoporin complexes are shown individually (blue and red) and after their preincubation (green). All SEC profiles were obtained using a Superdex 200 10/300 GL column. Gray bars indicate fractions that were resolved on SDS-PAGE gels and visualized by Coomassie staining. (E) Close-up view of the Nup170CTD•Nup145NR3 complex. (F) Close-up view of the corresponding surface in scNup170CTD (PDB ID 3I5P) revealed that both hydrophobic binding pockets for Nup145NR3 are conserved (23). The conserved residue, F1308, which was mutated in the interaction experiments in figs. S46 and S47 is indicated by an asterisk. (G) Summary of the results of interaction experiments performed with S. cerevisiae Nup145N homologs. Check marks indicate complexes that can form in SEC-MALS experiments, crosses indicate complexes that do not form, and dashes indicate complexes that were not tested. (H) Summary of the results of interaction experiments performed with S. cerevisiae Nup53. Check marks indicate complexes that can form in SEC-MALS experiments, crosses indicate complexes that do not form, and dashes indicate complexes that were not tested.
Fig. S51. Purification protocol for Nup120•Nup37•ELYS•Nup85 hetero-tetramer. Domain boundaries of the purified nucleoporins are shown with black lines indicating the construct boundaries. Sequential chromatography purification steps are shown from top to bottom with the employed columns indicated. Gray bars indicate fractions that were resolved on SDS-PAGE gels and visualized by Coomassie staining. Pooled fractions are indicated with a black bar above the SDS-PAGE gels. For details of the buffer conditions see Table S9.
Fig. S52. Purification protocol for the Sec13•Nup145C hetero-dimer. Domain boundaries of the purified nucleoporins are shown with black lines indicating the construct boundaries. Sequential chromatography purification steps are shown from top to bottom with the employed columns indicated. Gray bars indicate fractions that were resolved on SDS-PAGE gels and visualized by Coomassie staining. Pooled fractions are indicated with a black bar above the SDS-PAGE gels. For details of the buffer conditions see Table S9.
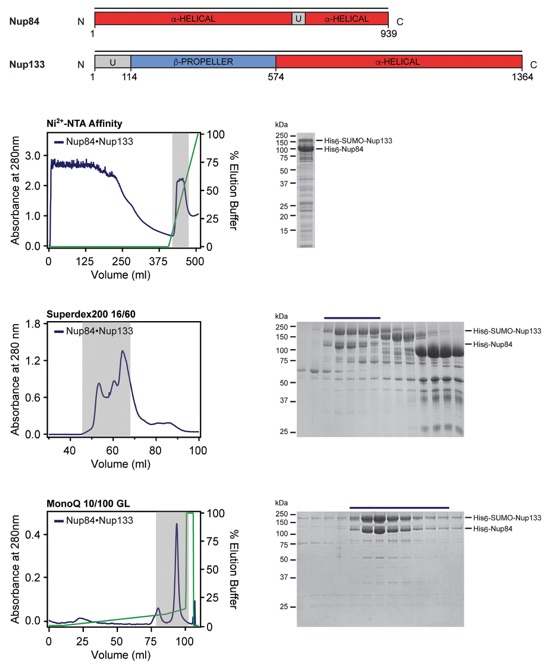
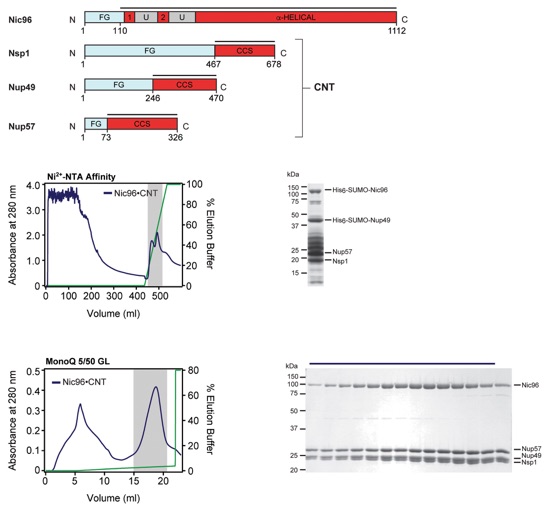
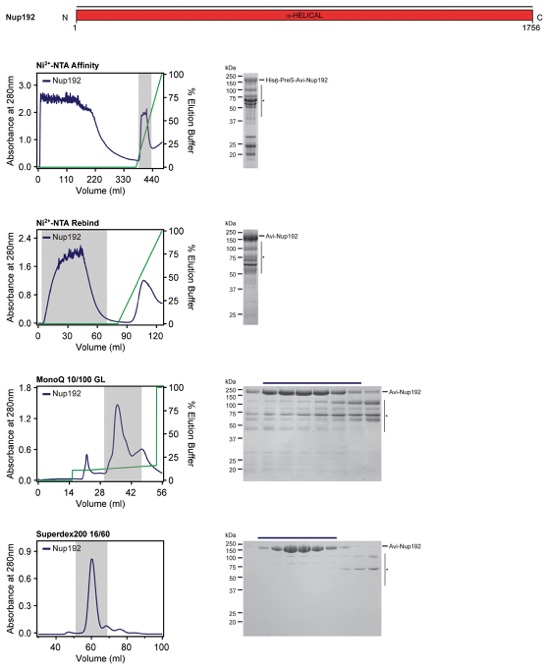
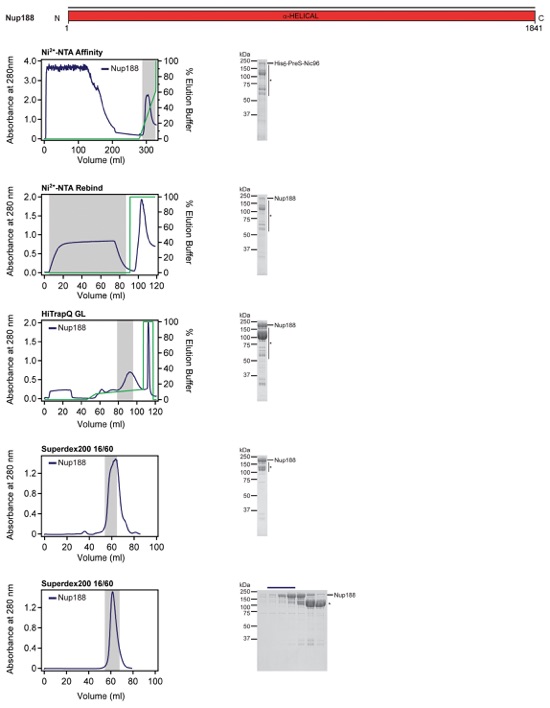
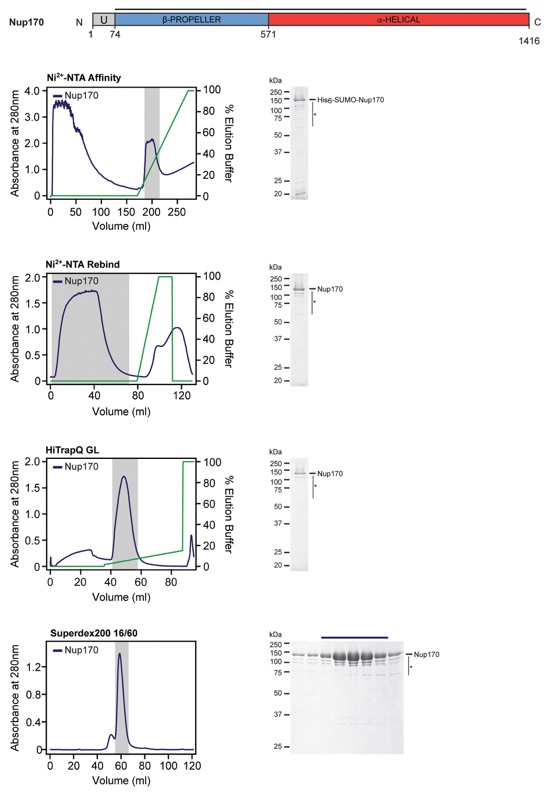
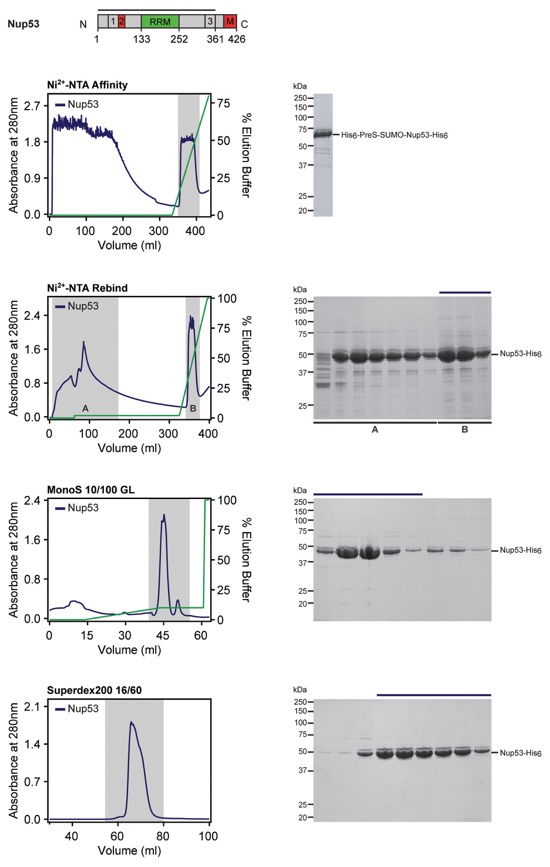
Fig. S53. Purification protocol for the Nup84•Nup133 hetero-dimer. Domain boundaries for the purified proteins are shown above with black lines indicating the construct boundaries. Sequential steps of purification via chromatography are shown from top to bottom, with the fractions pooled for the subsequent step highlighted in grey. SDS-PAGE gels for each step of the purification are shown next to each chromatogram. Buffer conditions can be found in Table S9.
Fig. S53. Purification protocol for the Nup84•Nup133 hetero-dimer. Domain boundaries for the purified proteins are shown above with black lines indicating the construct boundaries. Sequential steps of purification via chromatography are shown from top to bottom, with the fractions pooled for the subsequent step highlighted in grey. SDS-PAGE gels for each step of the purification are shown next to each chromatogram. Buffer conditions can be found in Table S9.
Fig. S54. Purification protocol for the CNT•Nic96 hetero-tetramer. Domain boundaries of the purified nucleoporins are shown with black lines indicating the construct boundaries. Sequential chromatography purification steps are shown from top to bottom with the employed columns indicated. Gray bars indicate fractions that were resolved on SDS-PAGE gels and visualized by Coomassie staining. Pooled fractions are indicated with a black bar above the SDS-PAGE gels. For details of the buffer conditions see Table S9.
Fig. S55. Purification protocol for Nup192. Domain boundaries of the purified nucleoporins are shown with black lines indicating the construct boundaries. Sequential chromatography purification steps are shown from top to bottom with the employed columns indicated. Gray bars indicate fractions that were resolved on SDS-PAGE gels and visualized by Coomassie staining. Pooled fractions are indicated with a black bar above the SDS-PAGE gels. For details of the buffer conditions see Table S9.
Fig. S56. Purification protocol for Nup188. Domain boundaries of the purified nucleoporins are shown with black lines indicating the construct boundaries. Sequential chromatography purification steps are shown from top to bottom with the employed columns indicated. Gray bars indicate fractions that were resolved on SDS-PAGE gels and visualized by Coomassie staining. Pooled fractions are indicated with a black bar above the SDS-PAGE gels. For details of the buffer conditions see Table S9.
Fig. S57. Purification protocol for Nup170. Domain boundaries of the purified nucleoporins are shown with black lines indicating the construct boundaries. Sequential chromatography purification steps are shown from top to bottom with the employed columns indicated. Gray bars indicate fractions that were resolved on SDS-PAGE gels and visualized by Coomassie staining. Pooled fractions are indicated with a black bar above the SDS-PAGE gels. For details of the buffer conditions see Table S9.
Fig. S58. Purification protocol for Nup53. Domain boundaries of the purified nucleoporins are shown with black lines indicating the construct boundaries. Sequential chromatography purification steps are shown from top to bottom with the employed columns indicated. Gray bars indicate fractions that were resolved on SDS-PAGE gels and visualized by Coomassie staining. Pooled fractions are indicated with a black bar above the SDS-PAGE gels. For details of the buffer conditions see Table S9.
Movie 1. Generation of the Nup170•Nup53R3•Nup145NR3 complex structure by superposition. A 360° rotation of the crystal structure of Nup170SOL is shown, followed by a demonstration of the process used for generating the full-length structure by superposition. Colors are the same as in fig. S25.
Movie 2. Morph animation of observed Nup170 conformations. The eight different conformations observed in the superposition-generated structures of full-length Nup170 are animated. The animation pauses at each of the eight experimentally observed conformations of Nup170, which are colored the same as in fig. S25.
Movie 3. Structure of the Nic96SOL•Nup53R2 complex. A 360° rotation of the crystal structure of Nic96SOL•Nup53R2 is shown. Colors are the same as in Fig. 4.
Movie 4. Generation of the structure of full-length Nup192 by superposition. A 360° rotation of the crystal structure of Nup192∆HEAD is shown, followed by a demonstration of the process used for generating the full-length structure by superposition. Colors are the same as in fig. S31.
Movie 5. Overview of the composite structure of the NPC symmetric core. The structures are shown as docked into the cryo-ET reconstruction of the intact human NPC, oriented with the cytoplasmic face on top and the nuclear face on the bottom.The nuclear envelope and protein densities are colored in gray and white, respectively. Crystal structures of symmetric core nucleoporins are first shown as cartoons (colored according to Fig. 5), then without the cryo-ET reconstruction density, and finally in surface representation.
Movie 6. Rotating structure of a single spoke of the NPC symmetric core. The crystal structures are shown as docked into the cryo-ET reconstruction of the intact human NPC, oriented with the cytoplasmic face on top and the nuclear face on the bottom. The nuclear envelope is colored in gray. Crystal structures of symmetric core nucleoporins are shown as cartoons colored according to Fig. 6.